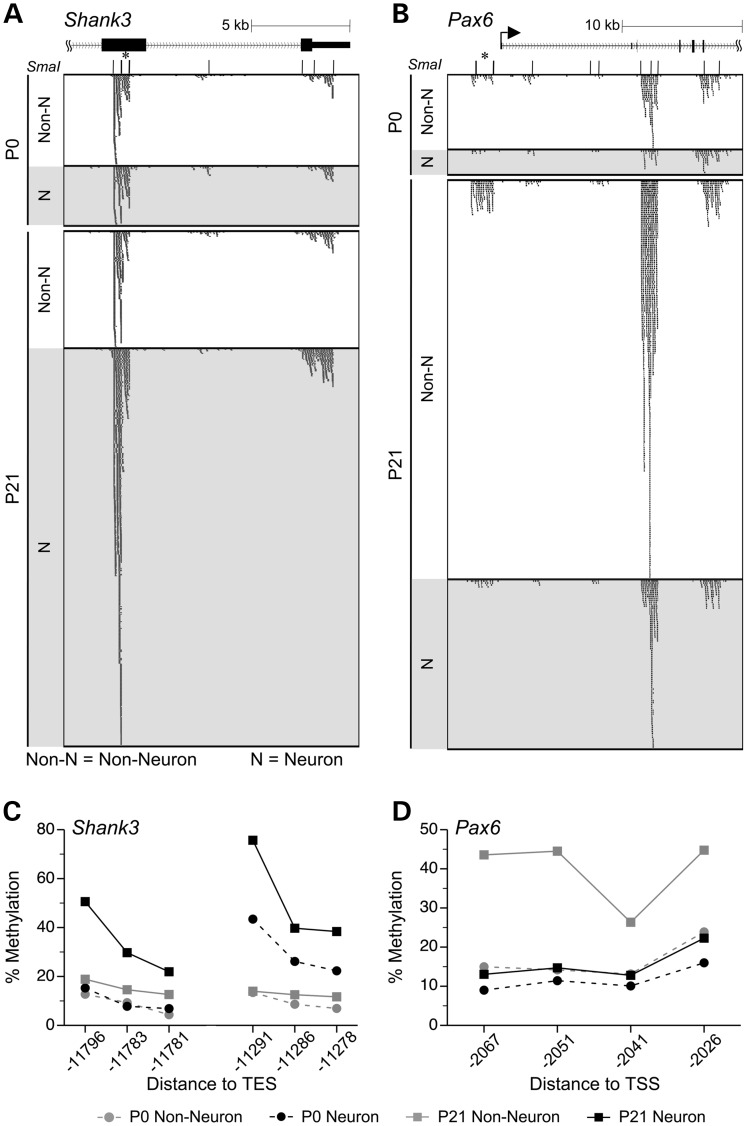
Figure 4.
DNA methylation changes detected by MSA-seq were validated by bisulfite pyrosequencing. (A) Near the 3′ end of Shank3, 4 SmaI/XmaI intervals spanning ∼10 kb showed concordant DNA methylation increases specifically in neurons. (B) At the 5′ of Pax6, 3 SmaI/XmaI intervals spanning >10 kb showed concordant DNA methylation increase in non-neurons. [In panels (A) and (B), asterisks indicate the SmaI/XmaI intervals that were significant by MSA-seq and selected for verification]. The DNA methylation increase specific to neurons at Shank3 (C) and the decrease specific to non-neuronal cells at Pax6 (D) were validated by bisulfite pyrosequencing. In panels (C) and (D), DNA methylation percentages are presented as means ± SEM of n = 5 per age per cell type (error bars smaller than symbols); line breaks indicate multiple pyrosequencing assays.

