
Fig. 4.
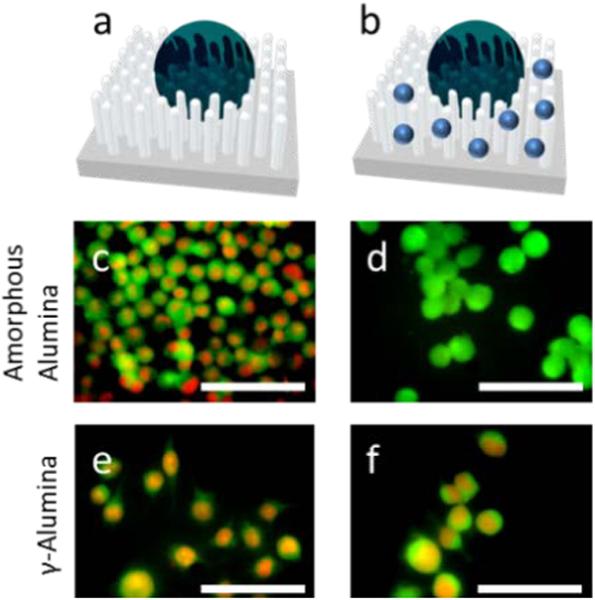
(a) Representation of a cell on the nanostructure array without inhibitor and (b) with the inhibitor (Ac-DEVD-CHO represented by blue dots), (c) and (e) DC 2.4 cells incubated onto amorphous alumina and γ-alumina arrays, respectively, with introduction of TNF-α, (d) and (f) DC 2.4 cells incubated with the same arrays as in (c) and (e) except coated with Ac-DEVD-CHO via adsorption. All scale bars represent 60 μm. In all images, propidium iodide (PI) staining is represented by red and the CFDA membrane dye is represented by green.