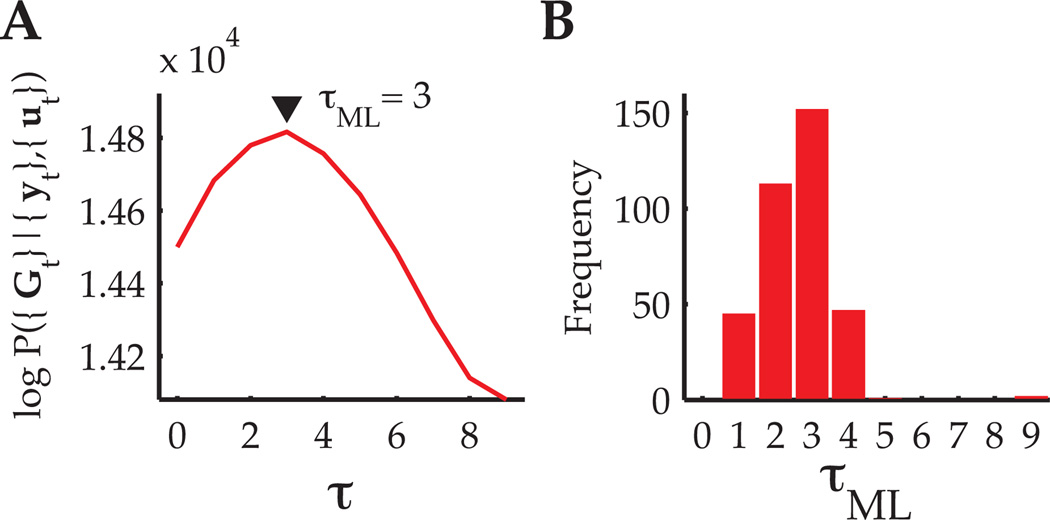
Figure 4.
Model selection for determining the feedback delay, τ. (A) Log-likelihood as a function of τ over training data from a single BMI experiment. For this representative experiment, the feedback delay that maximized the data likelihood was τML = 3 timesteps (100 ms). (B) Histogram of τML values across 36 experiments (10 folds each).

