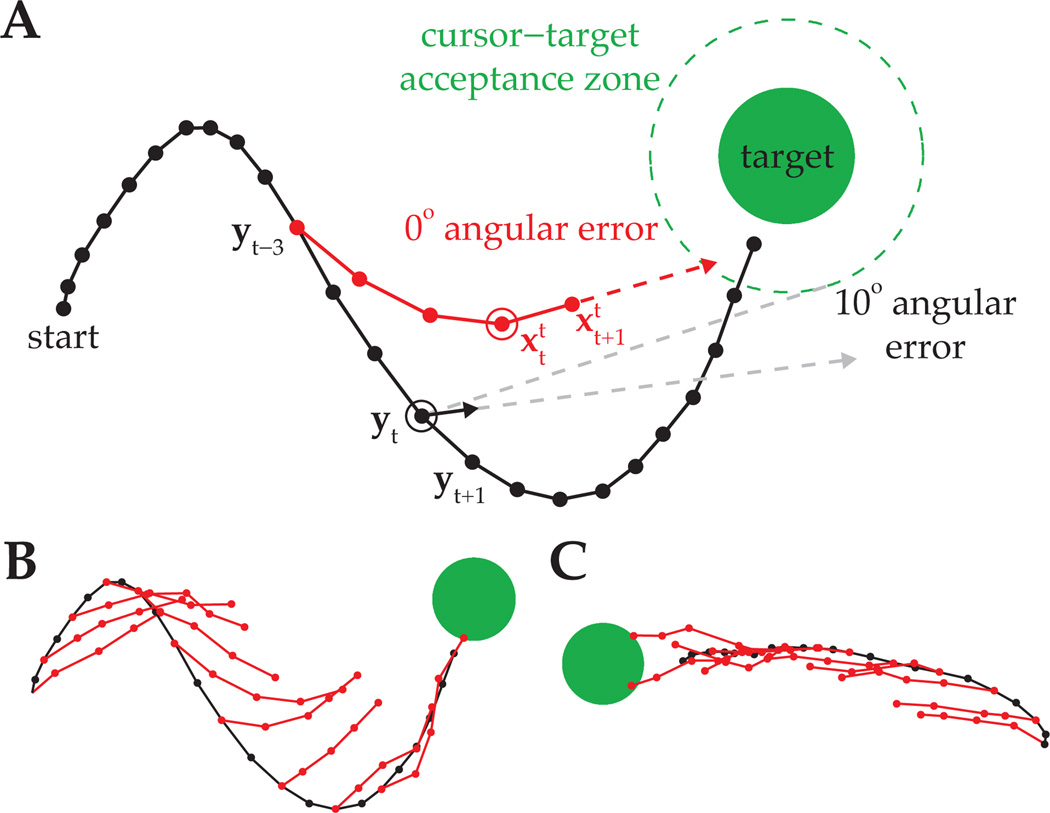
Figure 5.
Evaluation of IME predictions. (A) Cursor trajectory (black line) from a BMI trial that was not used in model fitting. Red points are IME-inferred internal estimates of cursor position as determined by (13). Black arrow is the single-timestep velocity command, vt, as computed through the actual cursor dynamics (14). Task success occurs when the cursor visibly overlaps with the target, which happens when the center of the cursor enters the cursor-target overlap zone (dashed green circle). (B) IME-inferred internal state chains across the entire BMI cursor trajectory from (A). (C) BMI cursor trajectory and IME-inferred internal state chains from a different trial.

