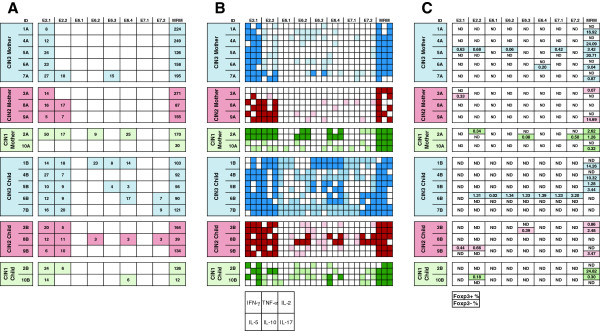
Figure 2.

Results of LST, cytokine and Foxp3 assays among CIN1, CIN2 and CIN3 mothers and their children. A) HPV16 specific lymphocyte stimulation test (LST) results. The mothers and their children are grouped according to the mothers CIN. Only positive responses are marked with colored box and stimulation indexes are given in the boxes under the corresponding peptide pools. The blue color is used for the mothers with CIN3 and their children, the red color for the mothers with CIN2 and their children and the green color represent mothers with CIN1 and their children (the same color codes are used also in Figure 2B and 2C). Memory response mix (MRM) was used as a positive control for LST assay. B) Cytokine assay results. Supernatants from the LST were analyzed for the presence of cytokines IFN-γ, TNF-α, IL-2, IL-5, IL-10, and IL-17. One square in a box with 6 squares represents the production of the cytokine type as given in the index box lowest in the figure. Cytokines found in those supernatants from wells with positive proliferative responses are marked with dark colors. Lighter colors are used when the corresponding LST result was negative. C) Foxp3 assay results. The box, when marked is divided into two parts. The upper value presents the percentages of (CD4 + CD25+) Foxp3–positive cells while the lower value presents the (CD4 + CD25+) Foxp3-negative cells after subtraction of the medium-only control value. Only positive (upregulation) responses are shown. Upregulation of Foxp3+/− cells is defined as at least twice the percentages of those in the medium-only control. Foxp3 = forkhead box P3, ND = not detectable.
