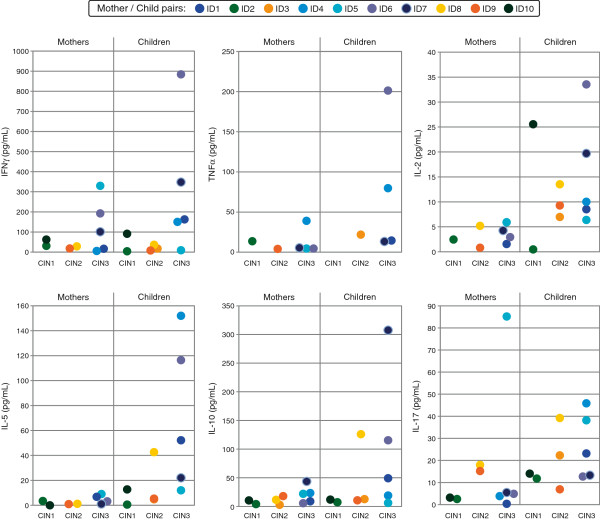
Figure 3.
Cytokines accompanying the proliferative response of T cells in the LST. The cumulative amounts of the individual cytokine for all peptide pools as determined by CBA are depicted. The mothers and their children are grouped according to the mothers CIN. Only cytokine levels above detection limits are shown. The children of mothers having developed CIN3, showed significantly higher IFN-γ (p = 0.032) and TNF-α (p = 0.008) levels than the other children. The cytokine levels of IL-2 (p = 0.023) and IL-5 (p = 0.028) induced by all peptide pools, were higher among the children than their mothers. In the pair-wise comparison of the mother-child-pairs, the levels of IL-2 and IL-5 showed statistically significant difference between the mother and child (p = 0.013 and p = 0.009, respectively). Control group of mothers showed highest cumulative amounts cytokine levels for IFN-γ (mean 139,03, range 12,99-210,13), IL-17 (mean 60,00, range 3,39-101,04) and IL-10 (mean 40,29, range 7,30-83,24) followed by IL-2 (mean 14,54, range 6,93-29,67), IL-5 (mean 13,65, range 1,65-29,13) and TNF-α (mean 2,88, range 0–6,41) (data not shown).

