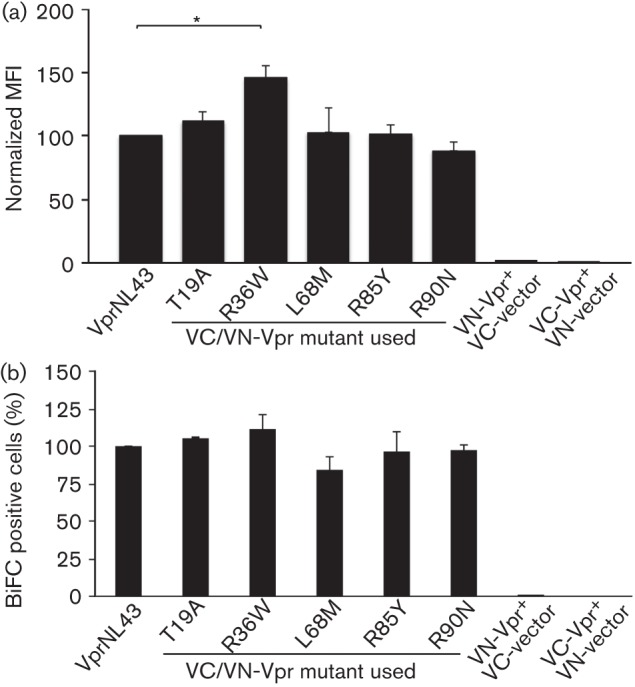
Fig. 3.

Visualization of Vpr variants’ oligomerization by (a) flow cytometry and (b) fluorescence microscopy. (a) Quantitative analysis of Venus fragment complementation in HEK293T cells was performed by co-transfecting cells with VC-Vpr and VN-Vpr or with VC/VN control plasmids. Thirty six hours post-transfection, cells were harvested and analysed by flow cytometry to determine the percentage of cells positive for BiFC fluorescence. The mean fluorescence intensity (MFI) of each mutant is normalized to wild-type, considered as 100 %. Results represent the means of five independent experiments. (b) The flow data were also analysed for transfection efficiency by the percentage of BiFC positive cells. BiFC (%) of each Vpr mutant is normalized to wild-type. The vector represents BiFC positive cells in VC and VN control plasmid co-transfection. Each graph represents the mean of five independent experiments. Error bars represent standard error of the mean. *P<0.05.
