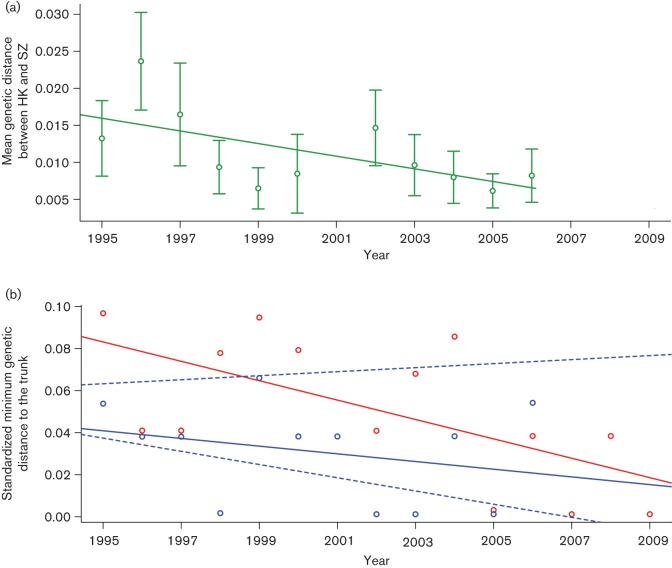
Fig. 3.
(a) Mean genetic distances between Shenzhen and Hong Kong between 1995 and 2009. Green dots and bar, mean and 95 % confidence interval of genetic distance between Shenzhen and Hong Kong; line, linear regression fit. (b) Standardized smallest distances from Shenzhen and Hong Kong isolates to the trunk of the global phylogeny between 1995 and 2009. Red dots and line, smallest distances from Shenzhen isolates to the trunk and linear regression fit; blue dots and solid line, smallest distances from Hong Kong isolates to the trunk and linear regression fit; blue dashed line, 95 % confidence interval of linear regression for 1000 subsampling mock datasets.

