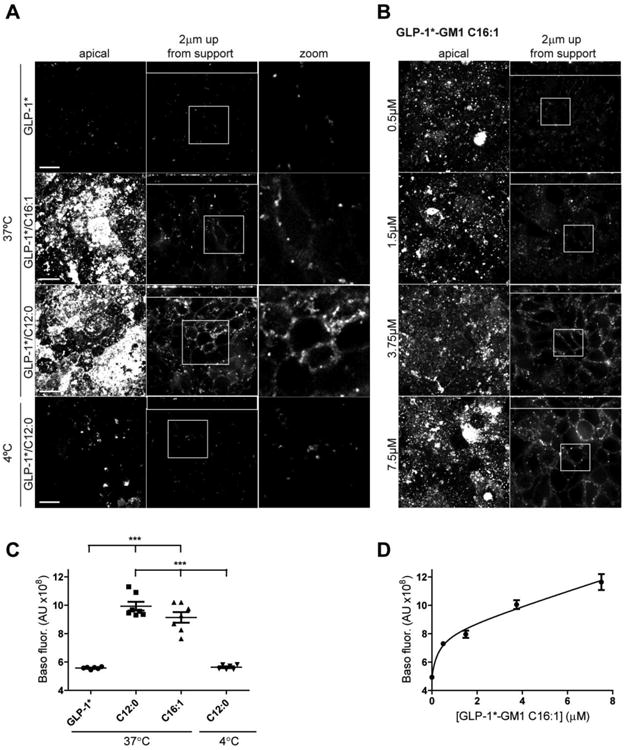
Figure 4. GLP-1*-GM1 crosses to the basolateral membrane of T84 monolayers by transcytosis.

The controls are monolayers incubated with free peptide or with GLP-1*-GM1 at 4°C and do not show a basolateral membrane staining. T84 cells grown on a membrane support were pulse labeled apically at 37°C for 1 h and then chased for 3 h with GLP-1* labeled GM1 C12:0, C16:1 or free peptide at 1 μM (A) or with varying concentrations of GLP-1*-GM1 C16:1 (concentrations as indicated, B). After washing, the cells were fixed and stained with. streptavidin-Al568. Illustrated are a confocal image of the apical membrane, basolateral signal at ∼2 μm up from the membrane support (small panels above are XZ reconstructions), and a zoom of the basolateral image. Data are representative of three independent experiments. Scale bars = 10 μm. (C-D) Quantification of the basolateral fluorescent signal at ∼2 μm up from the membrane support of images obtained in experiment A and B. Each dot represents a single field of view containing 45 cells on average and between 5 - 7 fields were analyzed (mean ± SEM). *** stands for p ≤ 0.001.
