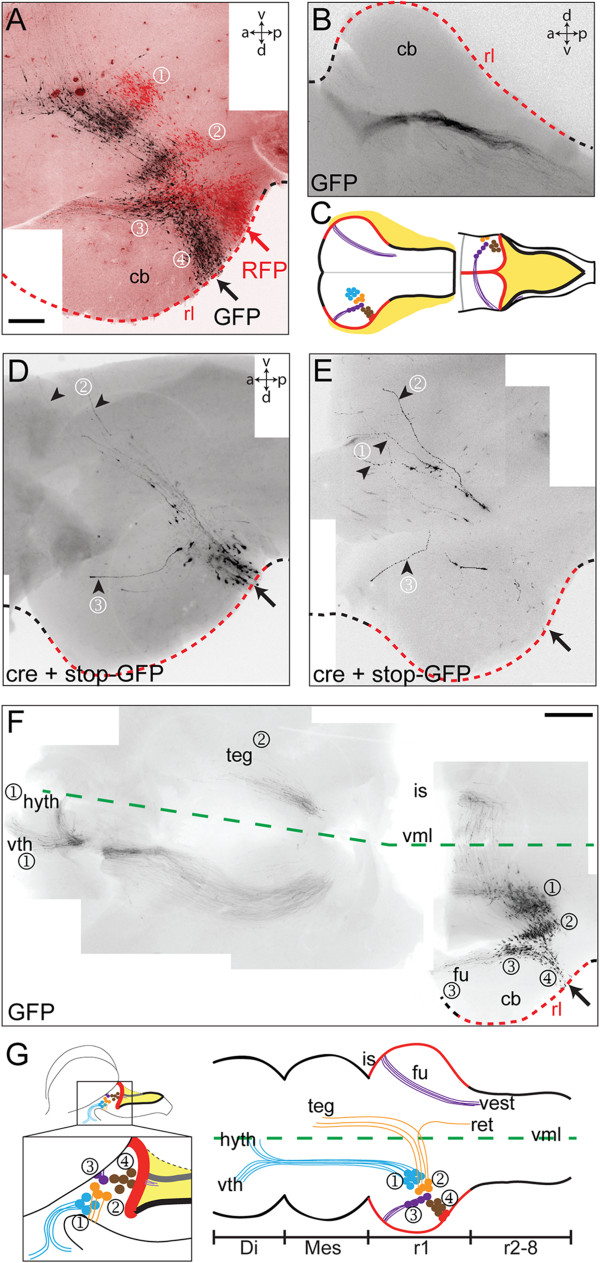
Figure 2.

Axon projections identify populations of rhombic lip derivatives. Labelled cell populations following electroporation (arrows) into the r1 rhombic lip at st.23/E4 of: (A) green fluorescent protein (GFP) and red fluorescent protein (RFP) side-by-side; (B) GFP in contralateral fasciculus uncinatus (fu) whose trajectory is schematically represented in C; (D, E) stop-GFP + diluted (10-4) cre to produce a scattered GFP label; (F) GFP, shown in a low magnification view of a reconstructed, flat-mounted hindbrain, midbrain and forebrain with the ventral midline (vml) shown as a green dashed line. G. Summary diagram of these data showing the relationship between cell groups and their axon targets: hyth, hypothalamus; vth, ventral thalamus; teg, tegmentum; is, isthmus; ret, reticular formation; vest, vestibular nuclei; di, diencephalon; mes, mesencephalon. Scale bars: 200 μm in A, B, D and E, 500 μm in F.
