
Figure 3.
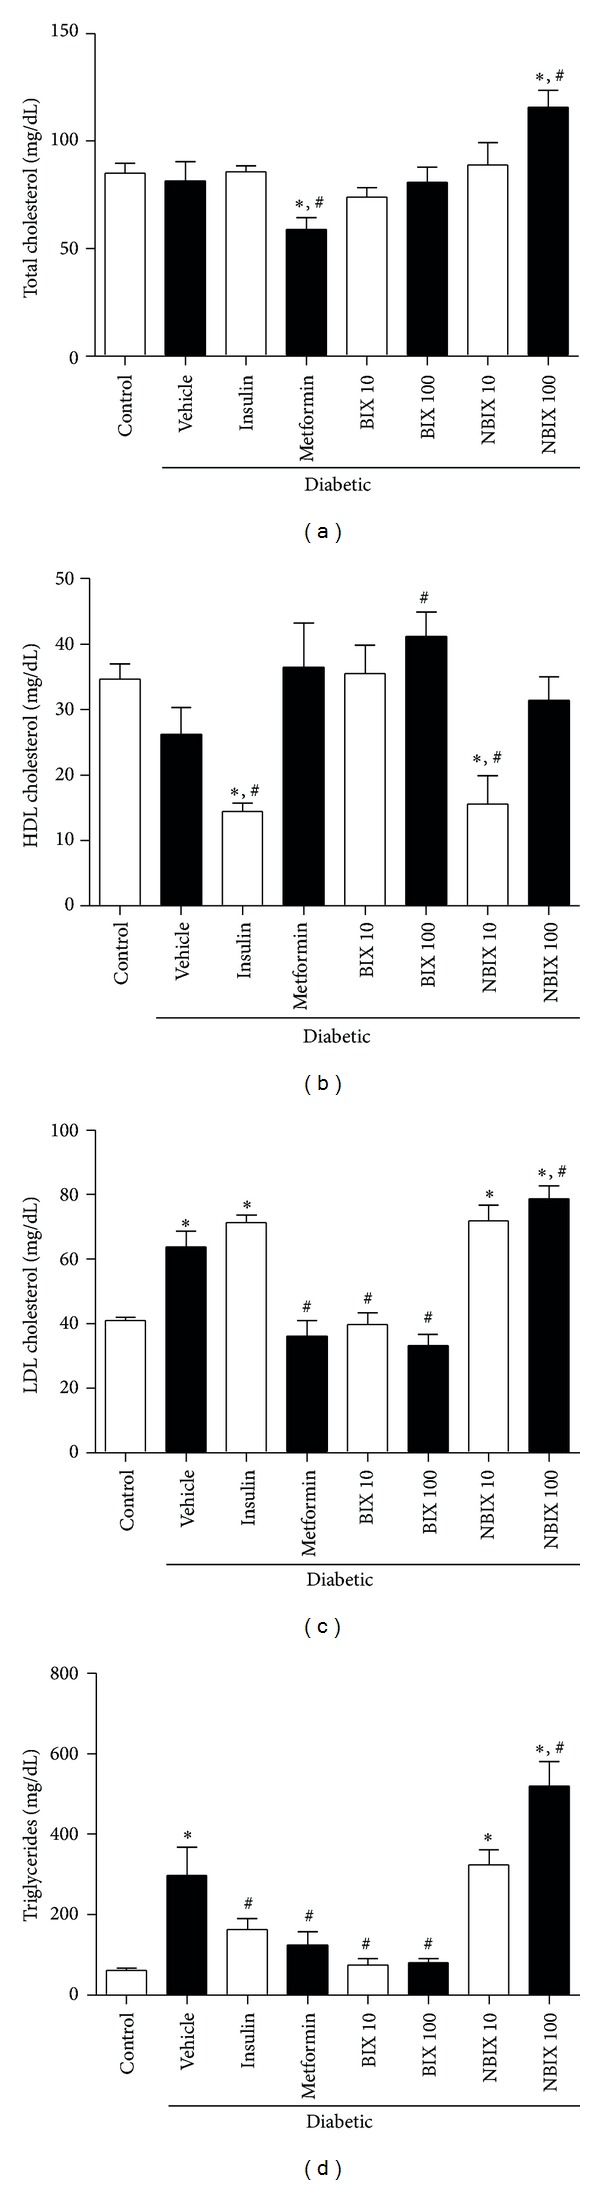
Lipid profile of streptozotocin-induced diabetic rats: total cholesterol (a), HDL cholesterol (b), LDL cholesterol (c), and triglycerides (d). Data are expressed as means ± SEM (n = 6 per group). ANOVA followed by Duncan's test: *P < 0.05 versus nondiabetic control; # P < 0.05 versus diabetic vehicle. BIX 10: 10 mg/kg bixin; BIX 100: 100 mg/kg bixin; NBIX 10: 10 mg/kg norbixin; NBIX 100: 100 mg/kg norbixin.