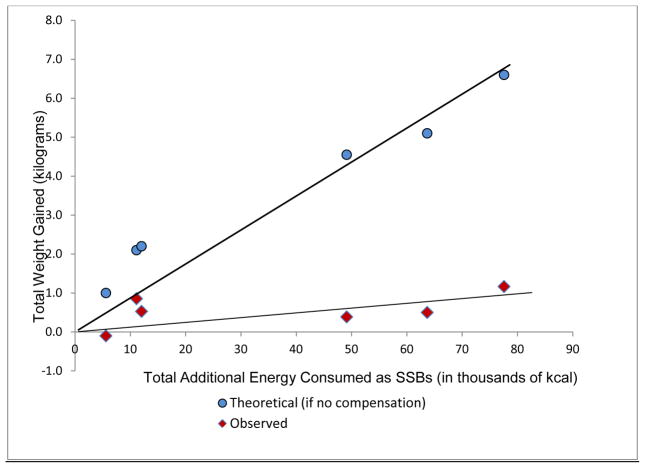
Figure 2.
Observed (30, 34, 40–42, 63) versus theoretical (64) weight gain effect of mandatory sugar-sweetened beverage (SSB) consumption.
Notes: For observed values on the Y axis, weight change was determined by the change of those drinking more SSBs minus those drinking less. The X axis was determined by multiplying the added kcal per day times the duration of the study divided by 1000. Fit lines were generated by setting the origin to zero and by using the linear regression (least squares) options in Microsoft® Excel. The theoretical values (round markers) were generated by entering mean baseline values for each study sample into the NIDDK Body Weight Simulator (64) and adding the same number of calories per day for the same number of days as reported in the studies (30, 34, 40–42, 63). Activity settings in the simulator were at the lowest level of sedentary and no activity or dietary changes over the study duration were entered into the simulator. Observed data represent an average energy compensation rate of 85% (range = 57% – 110% compensation).

