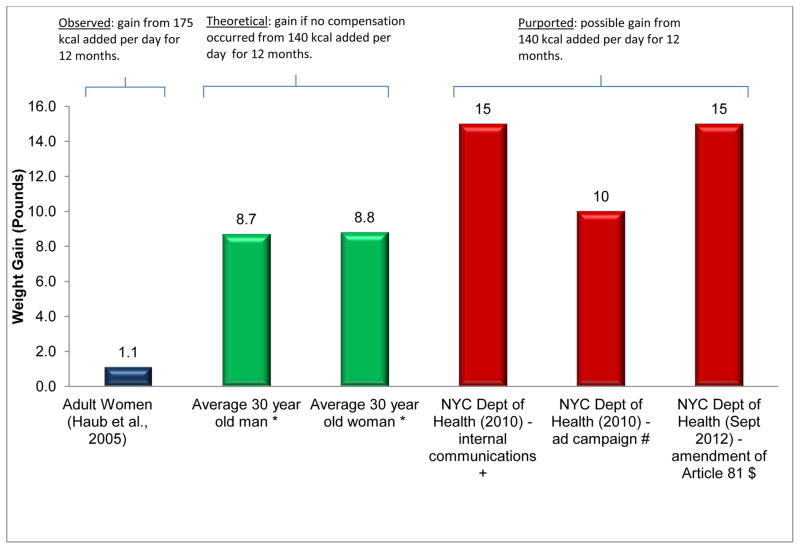
Figure 6.
Comparison of weight gain attributed to consumption of sugar-sweetened beverages for one year from various sources.
Note: For the Haub study, the weight change shown above is adjusted by subtracting the control group weight change.
* Body Mass Index of 27.8 kg/m2 (NHANES 2010 50th percentile for both men and women in the United States (66) entered into NIDDK body weight simulator (64).

