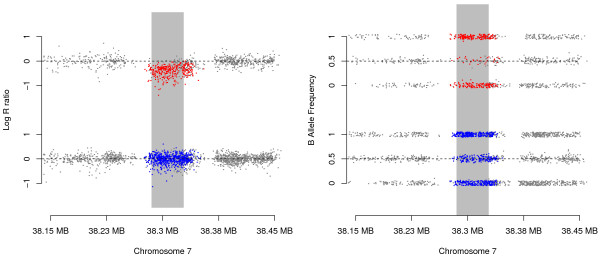
Figure 3.

The log R ratios (left) and B allele frequencies (right) near the identified 7p14.1 locus. The upper panels (containing the red dots) represent the 10 oral cleft probands with MinimumDistance inferred de novo deletions at this locus, the lower panels (containing the blue dots) show the data for the parents of these probands. For each subject (parent or proband), color was used for the markers within the inferred de novo deletions (which differ in length between trios), gray dots were used for markers outside the deletions. The vertical gray bar indicates the segment of markers that yielded the most significant association test. For visualization, slight horizontal jitter was applied for both plots, and vertical jitter was applied for the B allele frequency plot.
