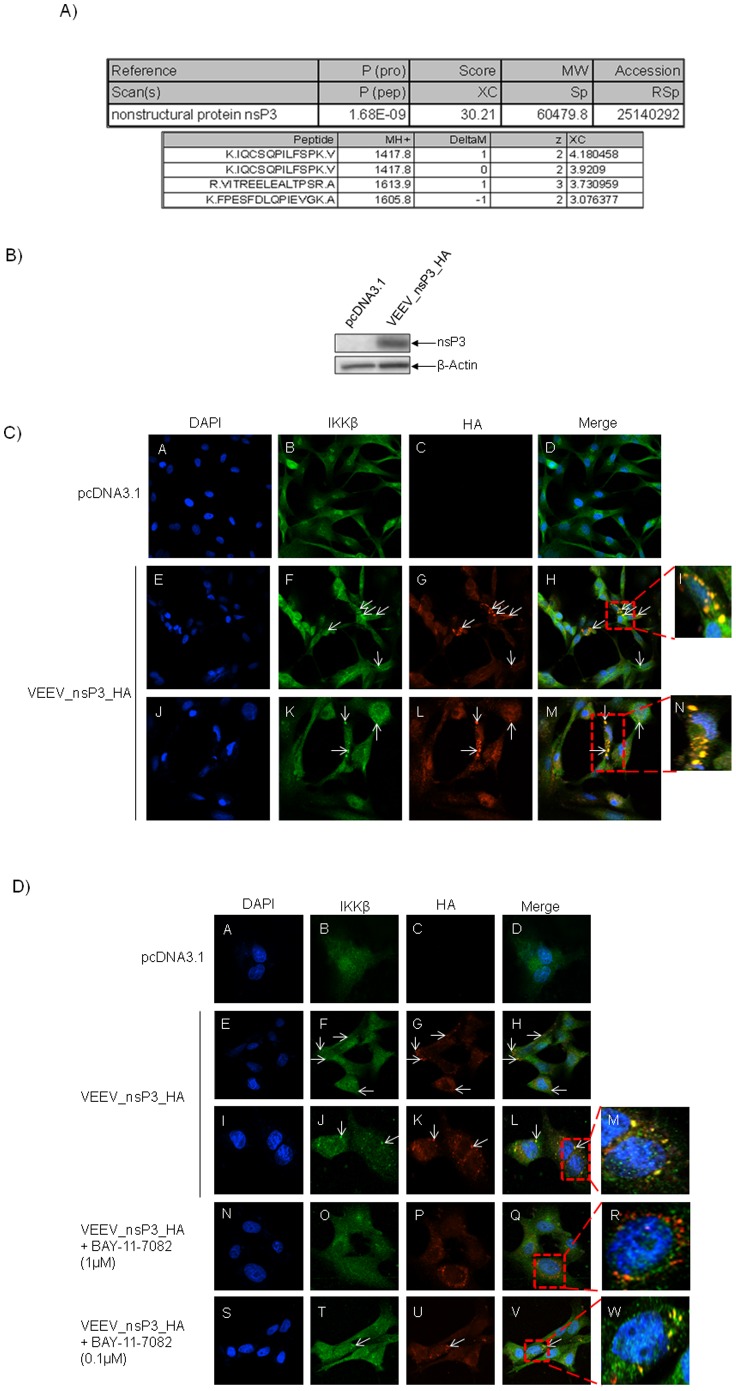
Figure 9. VEEV nsP3 interaction with host IKKβ.
A) IKKβ was immunoprecipitated from VEEV infected U87MGs and Liquid Chromatography Tandem Mass Spectrometry (LC-MS/MS) was performed. Control immunoprecipitations were performed with an IgG antibody. Mass spectrometry analysis revealed that the viral nonstructural protein nsP3 interacted with IKKβ. B) U87MGs were transfected in a 6-well plate with 5 µg of pcDNA3.1 and VEEV_nsP3_HA for 24 and 48 hours. Cell lysates were resolved using SDS-PAGE and subsequently immunoblotted with HA and β-actin served as a loading control. C) U87MGs were transfected in duplicate with (0.2 µg) VEEV_nsP3_HA and pcDNA3.1 (control), cells were fixed after 24 hours and probed with antibodies against the endogenous IKKβ and the HA tag. Cells were subsequently incubated with appropriate secondary Alexa Fluor antibodies and the nuclei stained with DAPI. Co-localization of IKKβ with nsP3 (yellow) was observed as shown by the arrows. The co-localization was confirmed by Z-stack analysis. Panels E–H and J–M serve as examples of transfected cells in a given field of view that show co-localization of IKKβ and VEEV_nsP3_HA at 24 hours post transfection. Panels I and N are magnified images of the outlined cells in red boxes in panels H and M respectively. Co-localization was found to be approximately in 71% of cells (72 cells were counted of which 55% demonstrated expression of nsP3. Of those cells that expressed nsP3, 71% showed co-localization of both IKKβ and VEEV_nsP3_HA proteins). D) U87MGs were transfected in duplicate with (0.2 µg) VEEV_nsP3_HA and pcDNA3.1 (control); cells were treated with BAY-11-7082 (1 µM and 0.1 µM). The cells were fixed 24 hours post transfection and probed with antibodies against the endogenous IKKβ and the HA tag. Cells were subsequently incubated with appropriate secondary Alexa Fluor antibodies and the nuclei stained with DAPI. Co-localization of IKKβ with nsP3 (yellow) was observed as shown by the arrows. The co-localization was confirmed by Z-stack analysis. Panels E–H and I–L serve as examples of transfected cells in a given field of view that show co-localization of IKKβ and VEEV_nsP3_HA at 24 hours post transfection. Panel M is a magnified image of the outlined cells in red boxes in panel L. Panels N–Q and S–V are examples of transfected and treated cells in a given field of view. Panels R and W are magnified images of the outlined cells in red boxes in panels Q and V respectively. Images were taken using Nikon Eclipse TE2000-U at 60× magnification and are representative of 3 independent experiments.

