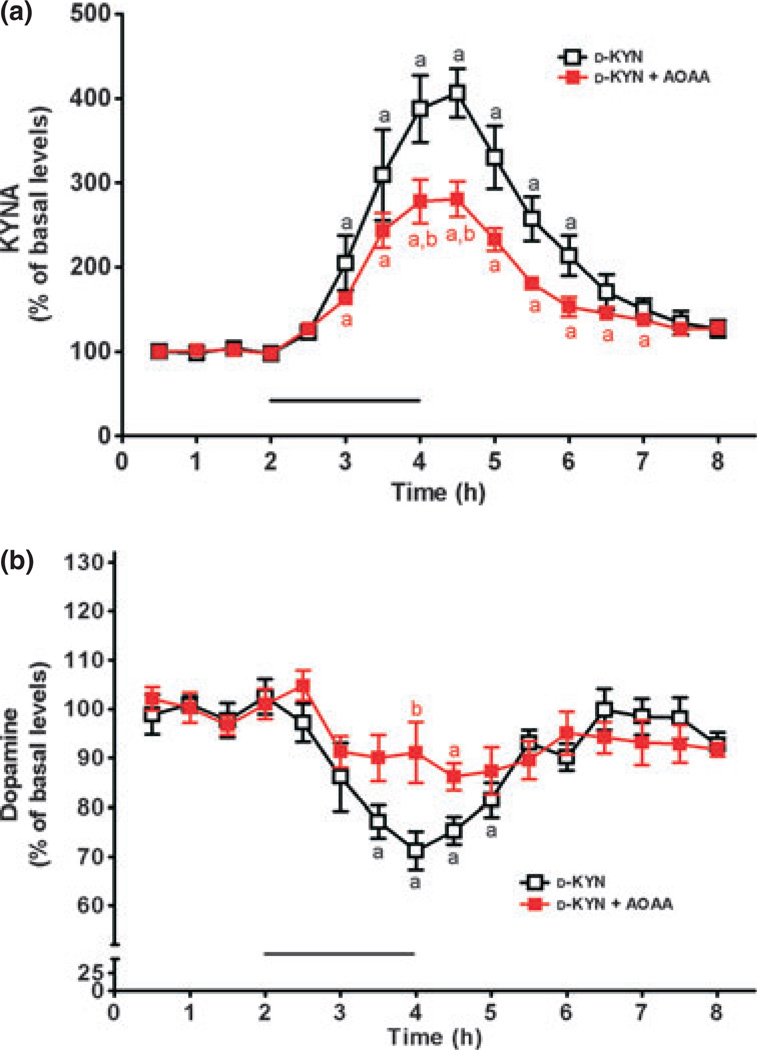
Fig. 4.
Effect of reverse dialysis of d-KYN (100 µM; bar) on extracellular KYNA (a) and dopamine (b) levels in the rat striatum. d-KYN was infused alone (open symbols, n = 8) or together with AOAA (2 mM; red symbols, n = 7). KYNA and dopamine were measured in the same microdialysate samples. See text for absolute baseline values. Data are the mean ± SEM. ap < 0.05 vs. baseline; bp < 0.05 vs. d-KYN alone (two-way anova followed by Bonferroni’s post hoc test).

