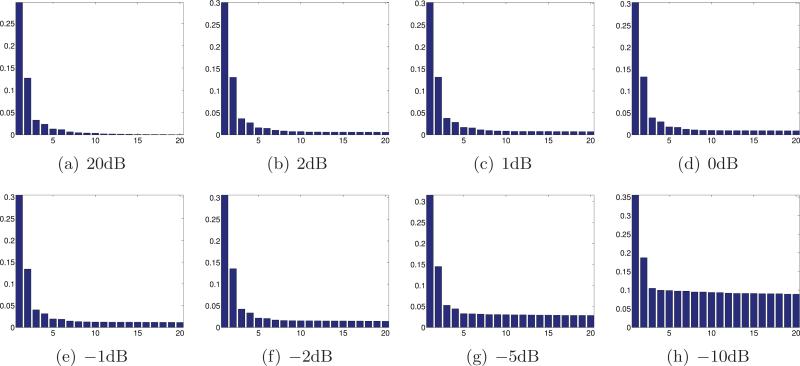
Figure 7.
Bar plots of the first 20 eigenvalues of the sample covariance matrix corresponding to noisy projections at different levels of noise. The numbers of significant principal components K̂ determined by [25] are 49, 12, 10, 10, 8, 7, 6, and 3.

