
Figure 2.
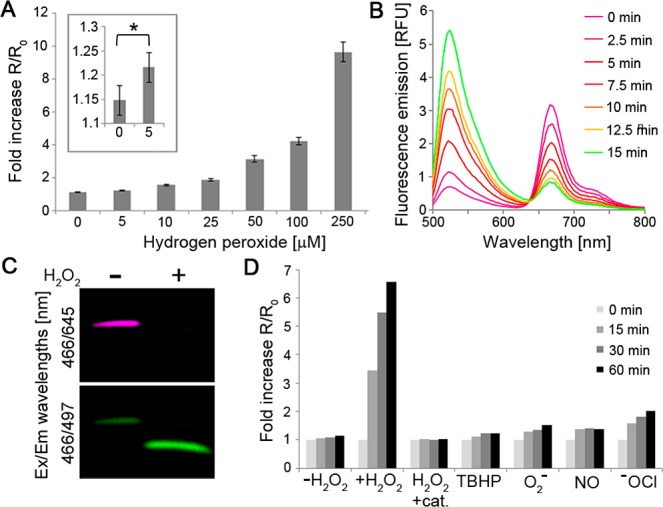
Selective and concentration-dependent cleavage of ACPP 1 by H2O2. (A) Fold increase in fluorescein/Cy5 emission ratio (524/672 nm) after 20 min incubation of ACPP 1 (1 μM) with indicated concentrations of H2O2. Error bars represent ± standard deviation. *p < 0.05. (B) Time course fluorescence emission spectra of ACPP 1 (1 μM) in the presence of H2O2 (1 mM). (C) H2O2-dependent cleavage of ACPP 1 (1 μM) after 30 min incubation with 1 mM H2O2. (D) Fold increase in fluorescein/Cy5 emission ratio at indicated times of ACPP 1 (1 μM) with indicated ROS or their donors (100 μM, catalase 0.5 mg/mL).