
Figure 3.
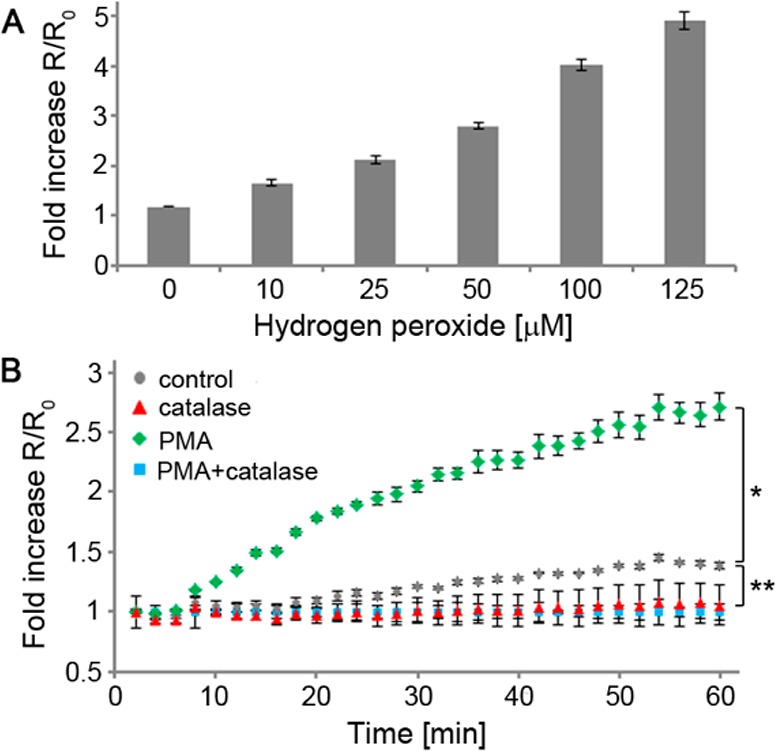
Detection of H2O2 by ACPP 1 in cellular environment. (A) Fold increase in fluorescein/Cy5 emission ratio (524/672 nm) after 30 min of ACPP 1 (1 μM) upon exogenous addition of H2O2 at indicated concentration in the presence of HL-60 cells. Error bars represent ± standard deviation. (B) Time course of fold increase in fluorescein/Cy5 emission ratio (524/672 nm) of ACPP 1 (1 μM) incubated with HL-60 cells at the indicated conditions (catalase 0.5 mg/mL, PMA 0.5 μM). Error bars represent ± standard deviation. *p < 1 × 10⁻¹⁰, **p < 1 × 10⁻⁴.