
Figure 1. Response to AZD3965 Correlated with Increased Intracellular Lactate.
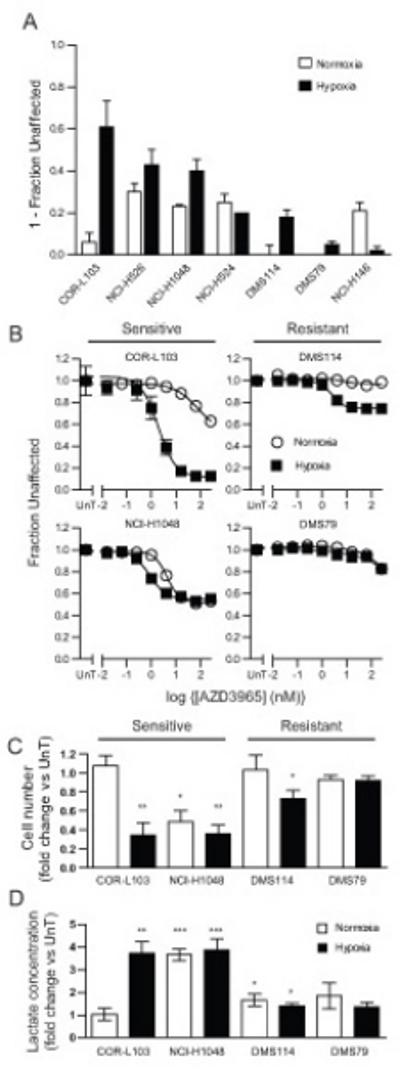
(A) Normoxic (white) or hypoxic (1 % O2, black) SCLC cell lines were treated with 8 nM AZD3965 for 72 hours and the effect of drug relative to vehicle treated cells determined by SRB assay (NCI-H1048 and DMS114 – adherent cells) or resazurin assay (other cell lines – suspension cells). Data is presented as 1-fraction of cells unaffected by AZD3965 relative to untreated control. (B-D) Normoxic or hypoxic COR-L103, NCI-H1048, DMS79 or DMS114 were treated for 72 hours with (A) the indicated concentration of AZD3965 or (B and C) 8 nM AZD3965. (A) SRB (NCI-H1048 and DMS114 – adherent cells) or resazurin assay (COR-L103 and DMS79 – suspension cells) were performed to assess the effect of AZD3965. Open circles, normoxic; closed squares, hypoxia. Data is presented as the fraction of cells unaffected by AZD3965 relative to untreated control. (B) Cell number was counted and expressed relative to untreated cells cultured under the same conditions. (C) Intracellular lactate was measured and expressed relative to untreated cells cultured under the same conditions. All graphs represent mean of at least three independent experiments carried out in triplicate (A and B) or duplicate (C and D) ± SEM. * p<0.05, ** p<0.01, ***p<0.001 according to paired two tailed t-test.