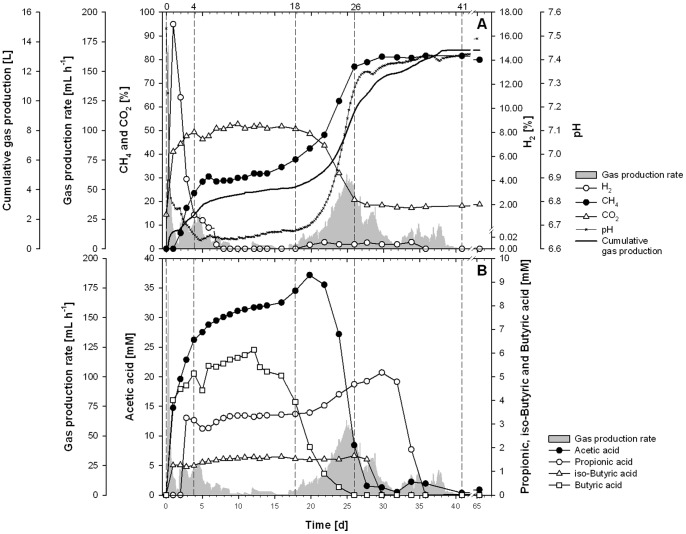
Figure 1. Fermenter performance.
pH-values, qualitative and quantitative properties of biogas (A) and concentrations of VFAs (B) during the fermentation. Gas production rate (grey background) is given in A and B to ease the comparison. Dashed lines at t = 0, 4, 18, 26, 41 outline the samples which were additionally investigated by molecular approaches.

