
Figure 3. Binning error relative to nearest-neighbors error.
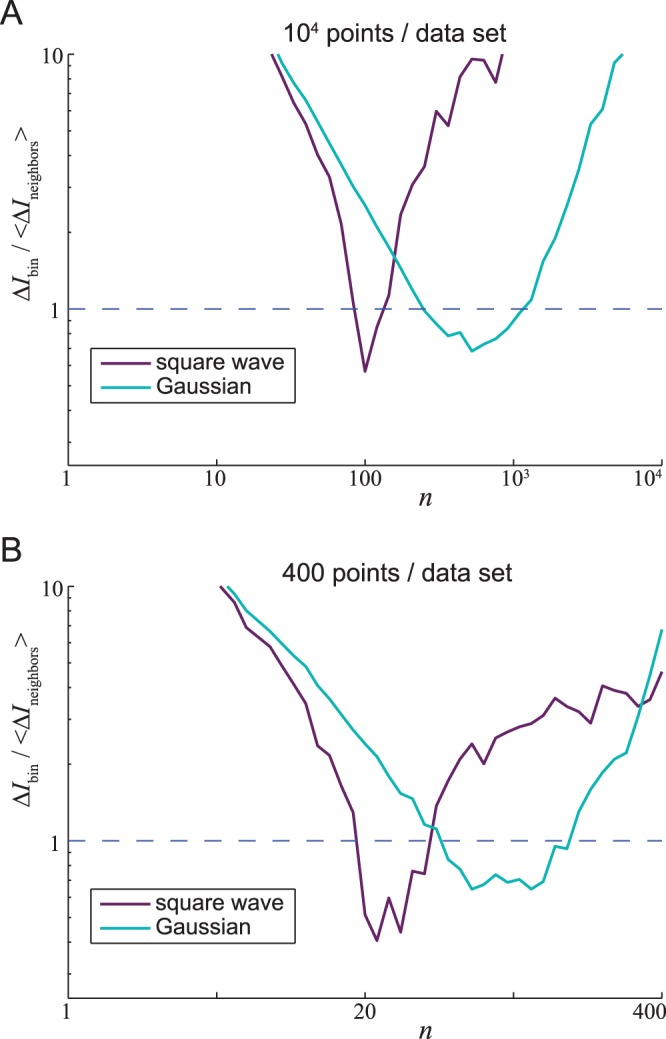
(A) Error from the binning method divided by error from the nearest-neighbor method. Errors in MI were calculated for each of the 100 data sets of the square-wave (light blue) and Gaussian (purple) 10,000-length data sets (see Figure 2). Each line shows the ratio of the median MI for a given number of neighbors  estimated using binning, as a function of n, to the median (over all data sets and all values of
  ) of all MI estimates using nearest neighbors. The binning method gives superior results for values of
  for which this ratio is less than one. Evidently, there is no optimal value of
  that works for all distributions:
  works well for the square wave distribution but
  is better for a Gaussian distribution. (B) MI error using nearest-neigbor method versus binning method for the 400-data point sets.