
Figure 2.
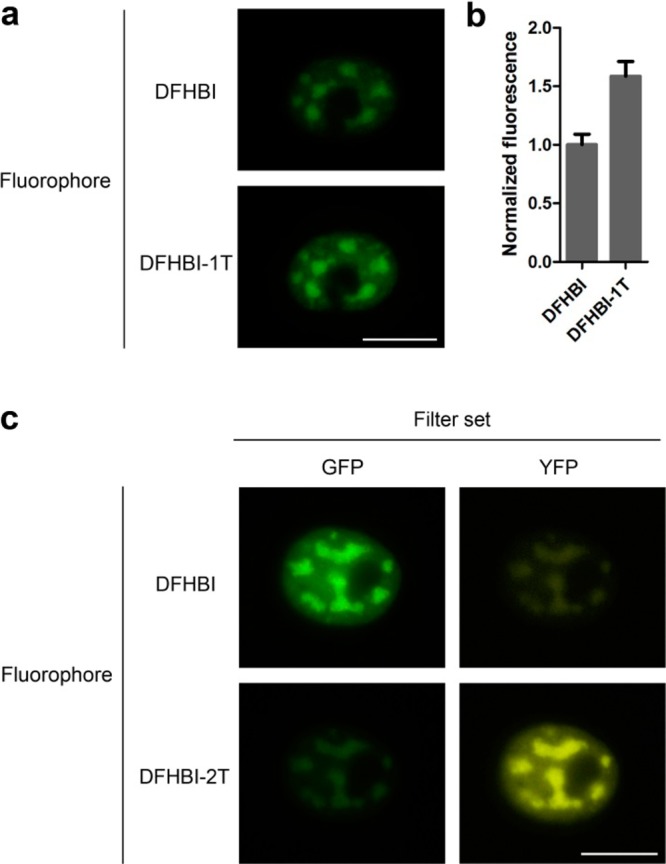
Live-cell imaging of Spinach2 fusion RNAs with different fluorophores. (a) COS7 cells expressing (CGG)60-Spinach2 in the presence of either DFHBI or DFHBI-1T. Cells were initially cultured in the presence of 20 μM DFHBI (top panel), and images were acquired using a 100 ms exposure. The media was then exchanged with media containing 20 μM DFHBI-1T for 10 min, and images of the same cell nuclei were obtained using identical image acquisition conditions. Increased fluorescence was seen in cells cultured with DFHBI-1T (lower panel). (b) Quantification of average brightness of 10 foci normalized to brightness of DFHBI. Average and SEM values are shown. (c) Cells expressing (CGG)60-Spinach2 in the presence of either DFHBI or DFHBI-2T were imaged using both GFP and YFP filter sets. Scale bar, 10 μm.