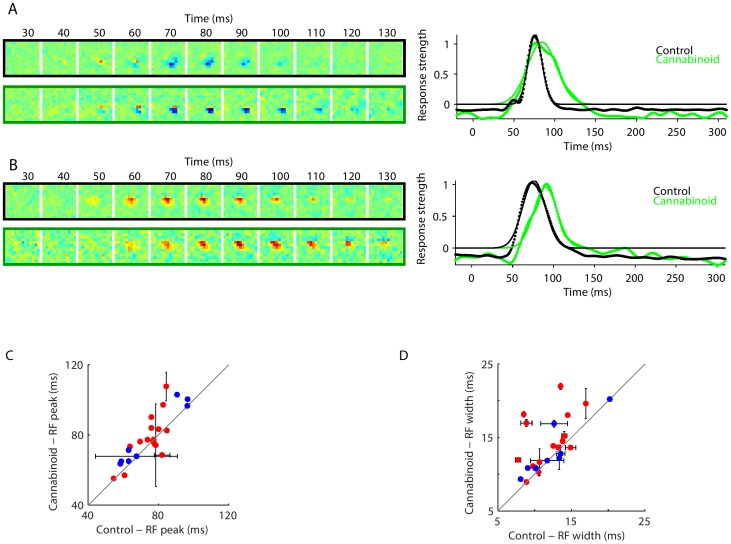
Figure 3. CP55940 alters V1 receptive fields.
Left: examples of spatiotemporal response functions for two neurons, unit L65t1.a (A), and unit L64t2.b (B), in the control condition (top row) and following cannabinoid administration (bottom row). Right: response profile (normalized mean-square values of the spatiotemporal response function at each time point), in each condition (dots), along with Gaussian fits (thin lines). (C) Response latency and (D) response duration in control and cannabinoid conditions, determined from the mean and standard deviation of the Gaussian fits to the response profile in V1 (red) and V2 (blue) neurons. For further examples, see Supplementary Figures 2 and 3 in File S1.

