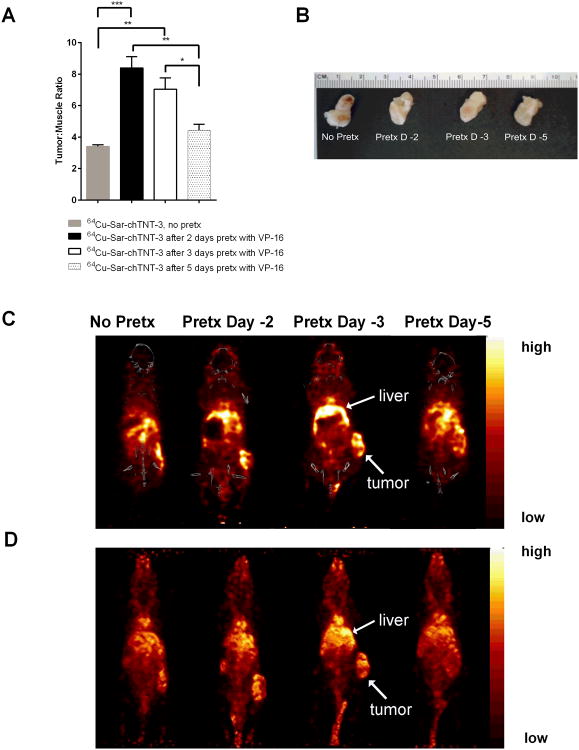
Figure 4.
MicroPET/CT images of 64Cu-Sar-chTNT-3 in MAD109-bearing BALB/c mice following VP-16 pretreatment. (A) Tumor to muscle ratios of radioactivity per volume of tissue measured 1 d post-injection of 64Cu-Sar-chTNT-3. Error bars represent standard error of the mean. * p < 0.05, ** p < 0.01, *** p < 0.001 as determine using one-way ANOVA followed by Tukey's post-hoc test. N = 3 mice for all groups. (B) Excised tumors from mice shown in C and D. (C) Representative PET/CT coronal sections taken 1 d post-injection of 64Cu-Sar-chTNT-3. (D) Representative whole-body PET images taken 1 d post-injection of 64Cu-Sar-chTNT-3. Liver and tumor uptake in C and D are labeled accordingly.

