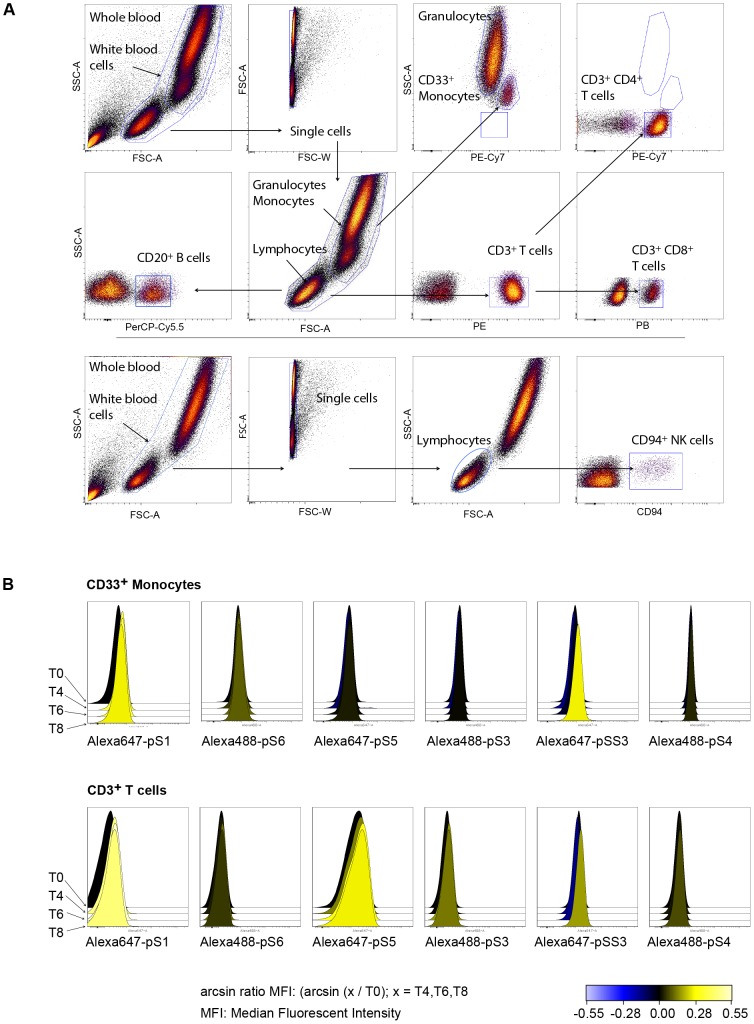
Figure 2. Gating hierarchy and Stats phosphorylation.
(A) Gating hierarchy in whole blood.. An average of about 11,000 events were collected for CD33+ monocytes, 4500 for CD20+ B cells, 30,000 for CD3+ T cells, 20,000 for CD3+CD4+ T cells, 7500 for CD3+CD8+ T cells, and 120,000 CD33+ granulocytes. (B) Histogram overlays of fluorescent intensities of antibody conjugated fluorochromes specific for indicated phosphorylated Stat proteins are shown before and after IFN-β administration. Phosphorylation levels for Stat proteins are shown in CD33+ monocytes and CD3+ T cells. Increased intensities are represented in yellow histograms.

