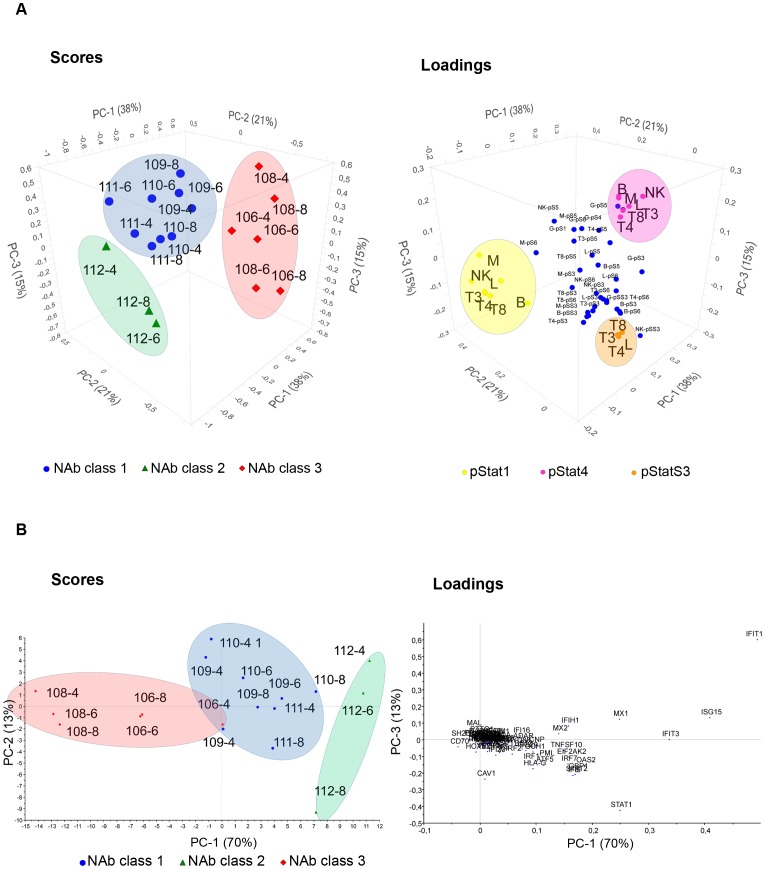
Figure 3. PCA of phosphorylated Stats proteins and gene expression levels.
(A) Scores and loadings are shown for the three first PCs from the PCA of data on phosphorylation levels of Stat proteins after IFN-β administration in vivo. In the score plot patients cluster according to NAb classes. Patients that are NAb negative are shown with blue roundels (class 1), NAb medium patients with green triangles (class 2) and NAb high patients with red diamonds (class 3). The loading plot reveals the variables important for patient clustering. pStat1 is negatively correlated with NAb class 3, and pStat1 and pStat4 are inversely correlated. In both score plots the patients are defined by numbers according to Table 1. p-S1 through p-S6: phosphorylated Stats proteins; L: lymphocytes; T3: CD3+ T cells; T4: CD3+ CD4+ T cells; T8: CD3+ CD8+ T cells; B: CD20+ B cells; M: CD33+ monocytes; G: granulocytes; NK: CD94+ NK cells. (B) Scores and loadings are shown for the two first PCs from the PCA of data on gene expression changes after IFN-β administration in vivo. Patients cluster according to NAb class. Time of sample collection confounds clustering. The variables in the loading plot are gene names.

