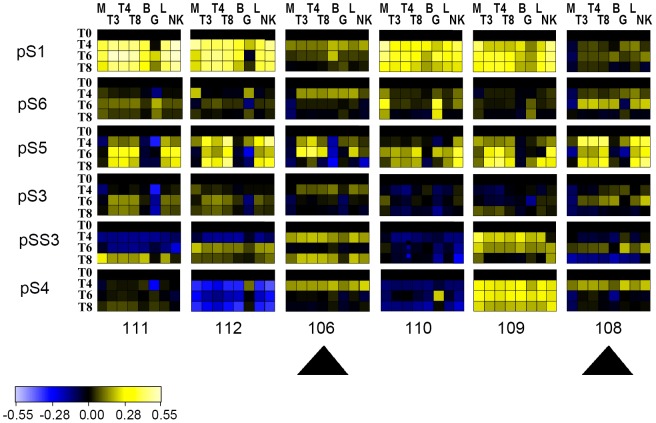
Figure 4. Heat maps of phosphoflow data.
Heat maps indicate median fluorescent intensities (MFI) changes of phosphorylated Stat proteins in cell subtypes. The MFI before administration of IFN-β is represented in black and increases in MFI are shown in yellow and decreases in blue. Patients with high NAb titers can be distinguished based on their phosphorylation patterns (arrows). Patients are numbered according to Table 1. T0: prior to IFN-β injection; T4, T6, T8: 4, 6, and 8 hours after IFN-β administration; p-S1 through p-S6: phosphorylated Stat proteins; M: CD33+ monocytes; T3: CD3+ T cells; T4: CD3+CD4+ T cells; T8: CD3+CD8+ T cells; B: CD20+ B cells; L: lymphocytes; G: granulocytes; NK: CD94+ NK cells.

