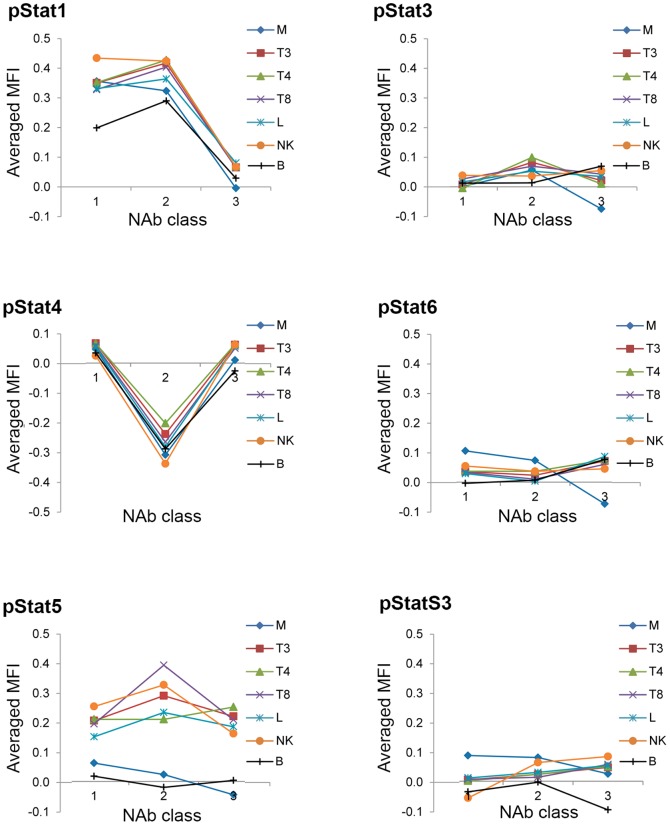
Figure 5. Time-averaged phosphoflow data of Stat proteins sorted by cell type and NAb class.
Visualization of ffMANOVA and ANOVA results with pivot tables graphs. Phosphoflow data (stimMFI/unstimMFI) for every patient for every cell subtype was averaged for time points t4, t6, and t8. The main factor, time of sample collection, did not affect the phosphoflow data significantly. The importance of pStat1 and pStat4 in NAb class identification are clearly visible. M: CD33+ monocytes; T3: CD3+ T cells; T4: CD3+CD4+ T cells; T8: CD3+CD8+ T cells; B: CD20+ B cells; L: lymphocytes, NK: CD94+ NK cells. Granulocytes are not shown. MFI: median fluorescent intensity.

