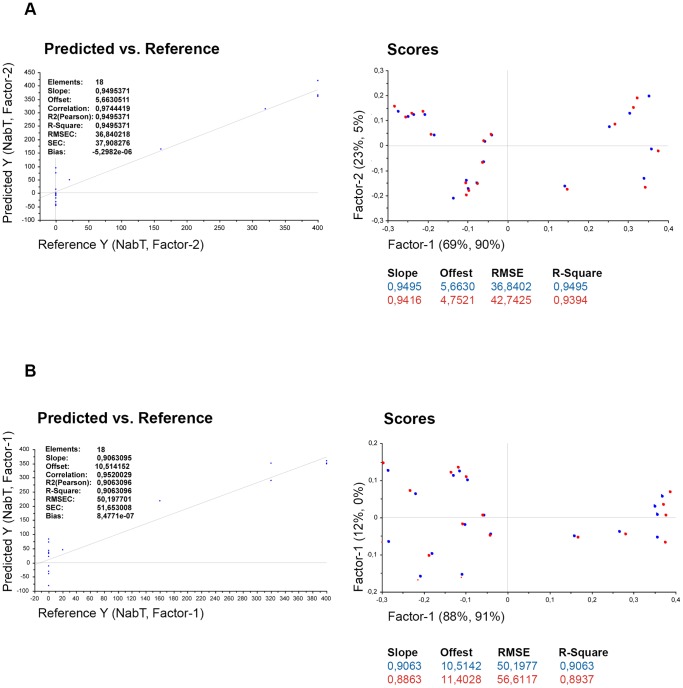
Figure 6. PLS model of pStat1 in CD33+ monocytes and lymphocytes and pStatS3 lymphocytes and PLS model of pStat1 in CD33+ monocytes and CD3+ T cells.
(A) PLS model for best prediction of NAb titers (NabT) is shown in the predicted versus reference plot. The predictor variables were pStat1 in CD33+ monocytes and lymphocytes and pStatS3 in lymphocytes; the response variable was NabT. In the scores plot, 95% of the variability in NabT is explained by 92% of the variability in the predictor variables using the first two factors. The blue circles represent samples for the calibration setup model, and the red circles represent the validation samples obtained by full cross validation. (B) PLS of model of interest where pStat1 in CD33+ monocytes and CD3+ T cells are used as predictors and NabT as response variables. RMSEC: root mean square error of calibration (blue) and of validation (red), respectively; SEC: standard error of calibration and is similar to RMSEC, except it is corrected for bias which is the mean value over all points that either lie systematically above (or below) the regression line. A value close to zero indicates a random distribution of points about the regression line.

