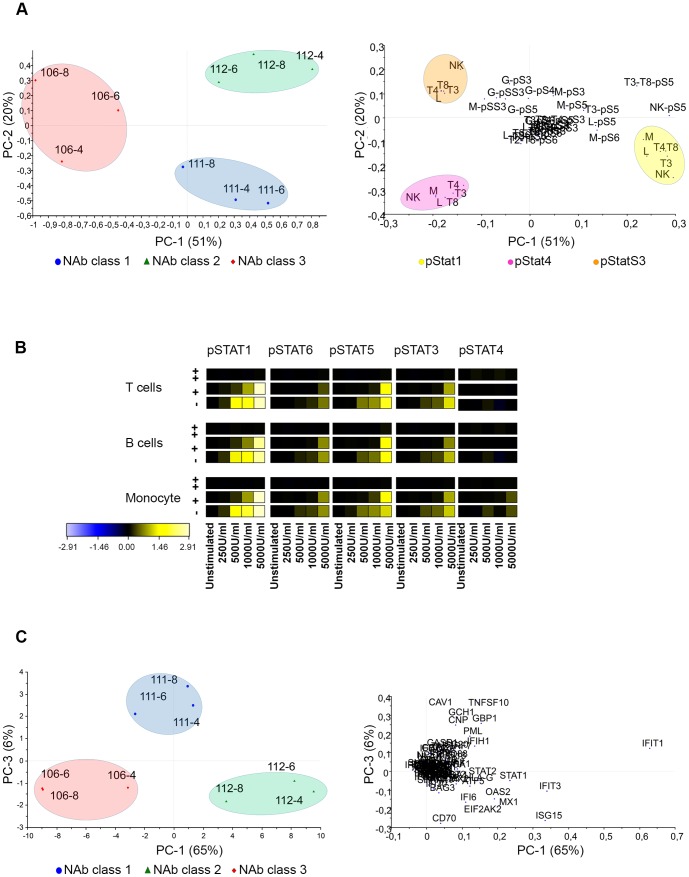
Figure 8. IFN-β-1a (Rebif) treatment analyzed separately.
(A) PCA of pStat proteins in patients treated with Rebif. NAb classes form distinct clusters for all measurements. The most important variables are highlighted in the loading plot. (B) Heat map dose-response curves of ex vivo re-stimulation with IFN-β in whole blood of the same patients. Patients are in different NAb classes: NAb negative (−), NAb medium (+), and NAb high (++). Unstimulated samples were used as reference samples and are shown in black. Increases in phosphorylation are shown in yellow. (C) PCA of genes in patients treated with IFN-β-1a (Rebif). For clustering according to NAb classes based on gene expression changes PC1 vs. PC2 were not useful. However, PC1 vs. PC3 did cluster patients according to NAb class. The first number in the identification of patients in the score plot is the patient number according to Table 1, and the second is the time of sample collection after IFN-β injection in hours. M: CD33+ monocytes; T3: CD3+ T cells; T4: CD3+CD4+ T cells; T8: CD3+CD8+ T cells; Cd20+ B cells; L: lymphocytes; G: granulocytes; NK: CD94+ NK cells; pS1 through pS6: pStat1 through pStat6.

