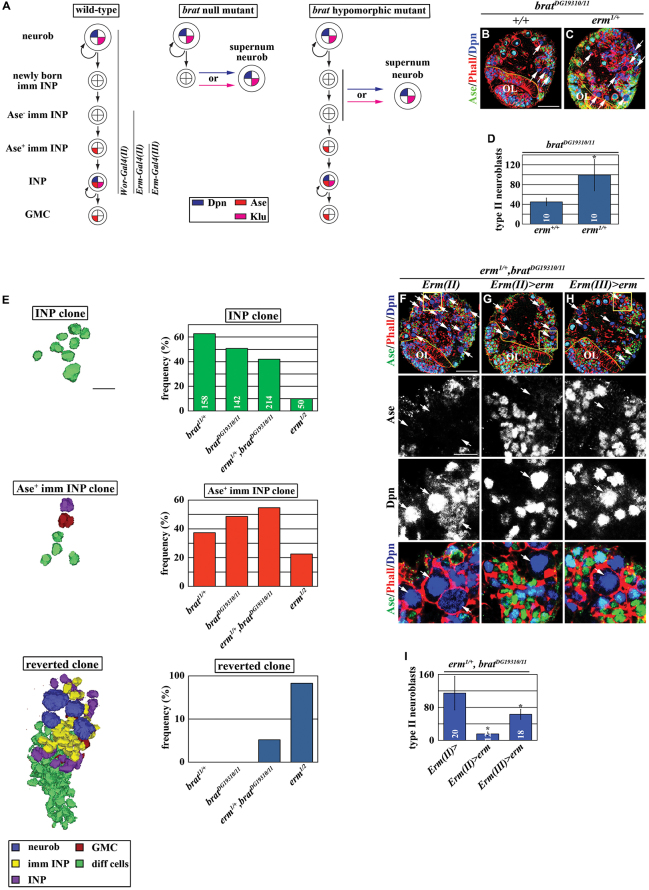
Fig. 1.
Erm functions in immature INPs to suppress supernumerary type II neuroblast formation. (A) A summary of the brat mutant phenotype and the expression patterns of the Gal4 drivers used in this study. Neurob, neuroblast; imm INP, immature INP; GMC, ganglion mother cell. (B-D) The heterozygosity of erm enhances the supernumerary neuroblast phenotype in bratDG19310/11 brains (as seen in B,C). Phalloidin (Phall) marks the cell cortex. Scale bar: 40 μm. (D) Quantification of the average number of type II neuroblasts (Dpn+Ase-) per brain lobe in larvae of the indicated genotypes. Error bars indicate s.d. (E) Reduction in erm function increases the frequency of formation of supernumerary neuroblasts originating from the Ase- immature INPs or INPs. Lineage clones marked with β-gal were induced and analyzed following the scheme shown in supplementary material Fig. S2. INP clone: a clone derived from a single INP; Ase+ imm INP clone: a clone derived from a single Ase+ immature INP; reverted clone: a clone containing supernumerary neuroblasts. The bar graphs show the frequency of clones observed in larval brains of the indicated genotype, and the total number of clones used to determine the frequency of the clones is shown in the bar graph for the INP clone. (F-I) Restoring erm function in the Ase- immature INPs or Ase+ immature INPs rescues the enhancement of the supernumerary neuroblast phenotype in bratDG19310/11 brains induced by the heterozygosity of erm. High magnification images of the boxed areas in the low magnification image are shown below. Scale bars: 40 μm (low magnification images); 10 μm (high magnification images). (I) The quantification of the average number of type II neuroblasts per brain lobe of the indicated genotypes. Key for this and all subsequent figures: dotted yellow line separates the brain from the optic lobe (OL); white arrow, type II neuroblast; white arrowhead, newly born immature INP and Ase- immature INP; yellow arrow, Ase+ immature INP; yellow arrowhead, INP. *P<0.05 between the marked genotype and the control genotype in the same bar graph, as determined by the Student’s t-test. n.s., not statistically significant.

