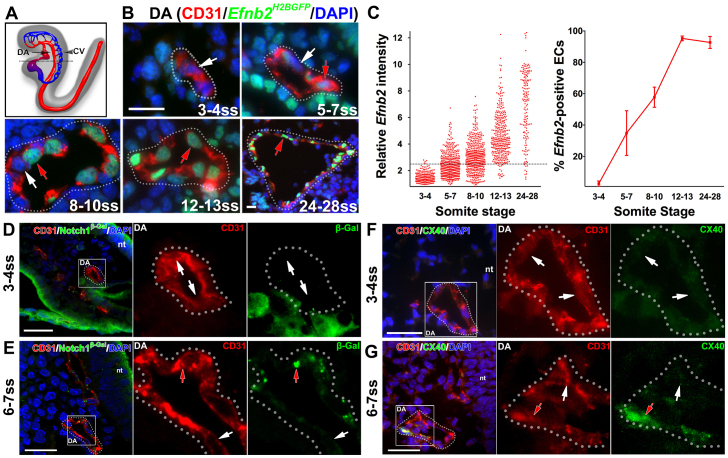
Fig. 1.
The dorsal aorta transiently contained both arterial marker-positive and -negative endothelial cells. (A-C) Arterial marker Efnb2 expression in cross-sections of the developing DA using the Efnb2H2BGFP/+ reporter. (A) Schematic lateral view of the DA (arrow) and the CV (arrowhead) at E8.5. The dotted black line indicates the level of cross-sections in B. (B) At 3-4 ss, the DA was composed of ECs without detectable Efnb2 expression. At 5-7 ss and 8-10 ss, both Efnb2-positive (red arrows) and -negative (white arrows) ECs were detected. By 12-13 ss, as well as at 24-28 ss, most ECs in the DA were Efnb2 positive. DA is outlined by a dotted line. (C) The intensity of Efnb2 expression in individual ECs was quantified and the average percentage of Efnb2-positive ECs ± s.e.m. was plotted. A relative Efnb2 intensity above 2.5, marked with a dotted line, was considered positive. (D-G) Expression of other arterial markers in cross-sections of the developing DA. (D,E) Notch1+/lacZ embryo stained for β-gal (reporter for Notch1) at 3-4 ss (D) and 6-7 ss (E). ECs in the DA were primarily negative for Notch1 expression (white arrows) at 3-4 ss. At 6-7 ss, Notch1-positive (red arrow) and -negative ECs were present in the DA. (F,G) Cx40 staining at 3-4 ss (F) and 6-7 ss (G). ECs in the DA were primarily negative for Cx40 expression (white arrows) at 3-4 ss, but at 6-7 ss, both Cx40-positive (red arrows) and -negative ECs were present in the DA. CD31 (red), arterial markers (green), DAPI (blue). Boxed areas are magnified in the right-hand panels. CV, cardinal vein; DA, dorsal aorta; nt, neural tube. Scale bars: 25 μm.

