Fig. 6.

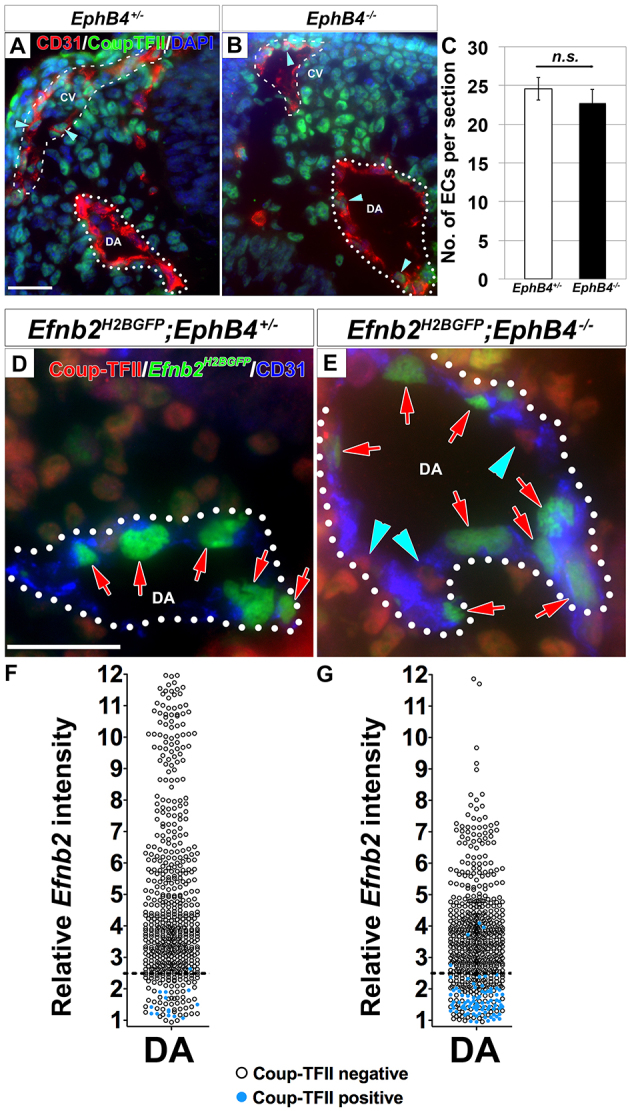
Coup-TFII-positive endothelial cells mislocalized to the larger dorsal aorta at the expense of the concomitantly smaller cardinal vein in EphB4-/- mutants. (A-C) Coup-TFII-positive ECs were detected in the DA in EphB4-/- mutants at 11-15 ss. Cross-sections of the DA (dotted line) and CV (dashed line) in 14 ss EphB4+/- (A) and EphB4-/- (B) embryos stained for Coup-TFII (green) and CD31 (red). EphB4-/- embryos exhibited an increased number of Coup-TFII-positive ECs in the larger DA (arrowheads), and a decreased number of Coup-TFII-positive ECs (arrowheads) in the smaller CV. This was accompanied by a similar increase in total number of ECs in the DA and similar decrease in the CV (see Table 1). There was no significant difference in total ECs in the DA and CV per section between EphB4+/- and EphB4-/- embryos (C). EphB4+/-: 24.6±1.5 ECs; EphB4-/-: 22.7±1.8 ECs; P=0.45, n=5. Error bars represent s.e.m. (D-G) Coup-TFII-positive ECs in the DA of EphB4-/- embryos did not express Efnb2. Cross-sections of the DA (dotted line) from 14 ss Efnb2H2BGFP/+;EphB4+/- control (D) and Efnb2H2BGFP/+;EphB4-/- mutant (E) embryos stained for Coup-TFII (red) and CD31 (blue). Coup-TFII-positive ECs (blue arrowheads) of the DA in the mutant did not co-express Efnb2 (red arrows). The Efnb2 intensity was quantified in Coup-TFII-stained EphB4+/- (F) and EphB4-/- (G) embryos at 11-14 ss. Relative Efnb2 intensity above 2.5 (dotted line) was considered positive. Blue circles indicate Coup-TFII-positive ECs and black circles indicate Coup-TFII-negative ECs. The Efnb2 intensity was below 2.5 for almost all Coup-TFII-positive ECs. DAPI (blue). CV, cardinal vein; DA, dorsal aorta. Scale bars: 25 μm.
