Fig. 4.
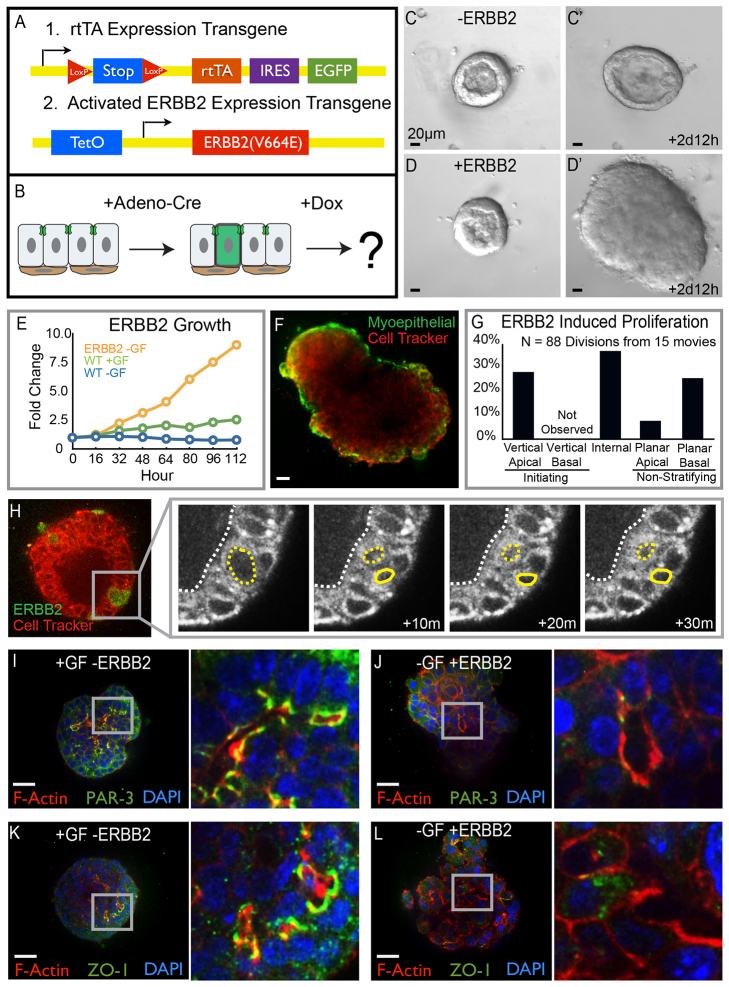
Oncogenic stratification shares a conserved cellular mechanism with developmental stratification. (A) Schematic of the transgenes used for conditional and mosaic expression of activated ERBB2. (B) Cartoon depicting the protocol followed to drive ERBB2 expression. (C-D′) Still images from time-lapse movies of unstimulated organoids in the presence or absence of ERBB2 expression. (C,C′) Organoids remained bilayered in the absence of ERBB2. (D,D′) Expression of ERBB2 in 80-90% of cells resulted in rapid stratification and growth. (E) Organoid growth rates were quantified as the increase in organoid area normalized to the initial organoid size. Growth curves for organoids expressing activated ERBB2 without exogenous growth factor are shown in orange, for control organoids with growth factor are shown in green, and for control organoids without exogenous growth factor are shown in blue. (F) Organoids expressing ERBB2 in 80-90% of cells were fixed and stained for smooth muscle actin (SMA, green), 3 days after gene activation. SMA, a marker of myoepithelial cells, showed that ERBB2-induced stratification increased the number of luminal epithelial cell layers. (G) Quantification of the types of cell divisions observed in ERBB2-expressing organoids. (H) Mosaic expression of ERBB2 in 1-10% of cells allowed observation of individual cellular responses to oncogene activation. ERBB2-expressing cells were labeled with GFP (green) and Cell Tracker Red was used to infer nuclear location. ERBB2-induced stratification initiated from vertical apical cell divisions. (I-L) Tissue was fixed and stained 3 days after addition of growth factor or activation of ERBB2 in 80-90% of cells. (I,J) Apical polarity was visualized by staining for PAR-3 (green) as well as F-actin (red) and nuclei (blue). (I) Polarized apical membranes were present at the apical surfaces of tissue treated with growth factor. (J) Tissue expressing ERBB2 lacked membrane localized PAR-3. (K,L) ZO-1 staining (green) was used to observe tight junctions; tissue was also stained for F-actin (red) and nuclei (blue). (K) Growth factor-treated organoids had ZO-1 localized to apical membranes. (L) Tight junctions were absent from apical membranes in cells expressing ERBB2; the inset shows a region of tissue lacking tight junctions. Scale bars: 20 μm.

