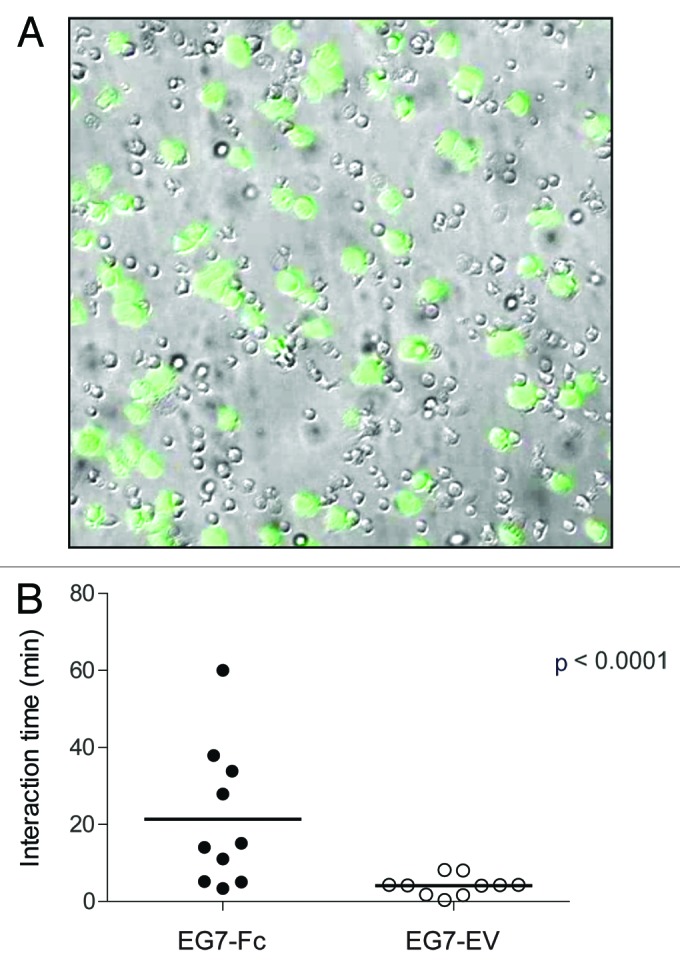
Figure 5. DC-Tumor interaction time is prolonged when tumors express IgG1-Fc. (A) A representative bright field and fluorescence image overlay from a 4 h time-lapsed imaging experiment with DCs co-cultured with GFP expressing cancer cells (green) is given. (B) Interaction times of DCs with tumor cells were analyzed as described in the materials and methods. The data are representative of two independent experiments and p values were determined by two-tailed unpaired t-test.
