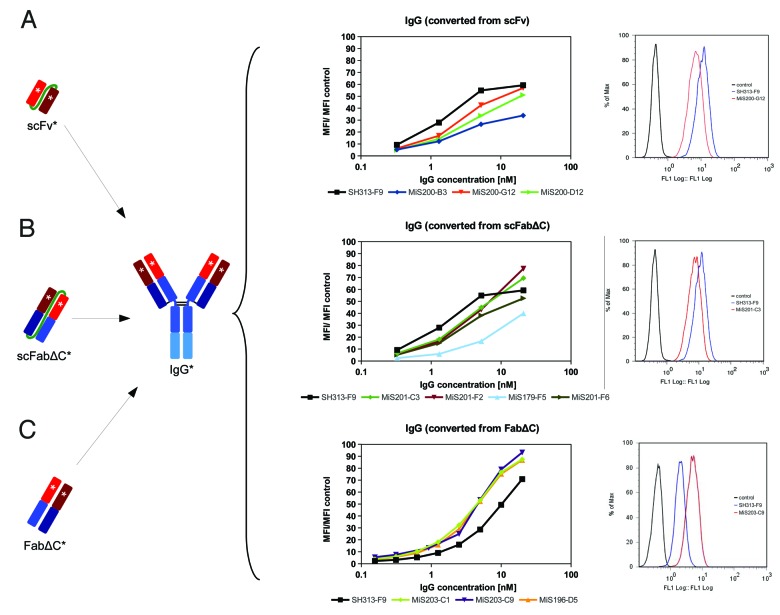
Figure 6. Cell binding of SH313-F9 variants. CD30+ Karpas299 cells were stained with a dilution series of IgGs which were converted from affinity matured scFv (A), scFabΔC (B), or FabΔC (C) candidates. The mean fluorescence intensities are summarized in the diagrams shown in the middle column. In addition, overlay histogram plots (right column) of CD30+ Karpas299 cells stained with 0.6 nM (C) or 1.3 nM (A and B) of representative affinity matured IgG candidates (red line) are shown in comparison to the parental SH313-F9 IgG (blue line). Cells only stained with secondary detection antibody conjugate are shown as negative control (black line).

An official website of the United States government
Here's how you know
Official websites use .gov
A
.gov website belongs to an official
government organization in the United States.
Secure .gov websites use HTTPS
A lock (
) or https:// means you've safely
connected to the .gov website. Share sensitive
information only on official, secure websites.
