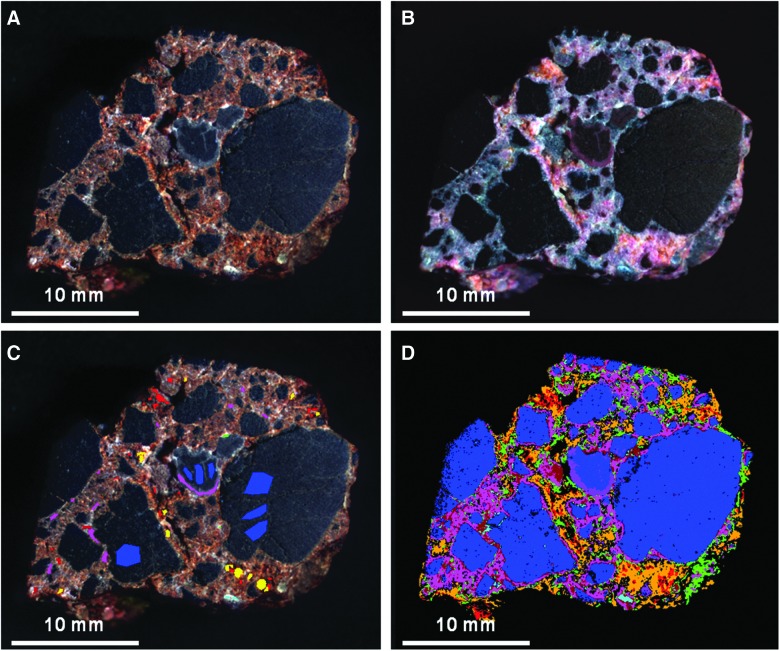
FIG. 19.
MMI-generated color composite images and endmember map of sample 10. (A) Visible-color RGB composite image composed of MMI bands 0.64, 0.52, and 0.46 μm, respectively, to simulate natural color. (B) False-color RGB composite image composed of MMI bands 1.66, 0.97, and 0.76 μm, respectively, to bring out subtle color differences in materials due to variations in composition. (C) Visible-color RGB composite similar to (A) with ROIs used to generate endmember map (D) and corresponding endmember spectra (Fig. 19A and 19B). (D) Endmember map generated in ENVI by using supervised classification with ROIs as input parameters to map endmember distribution. Each MMI subframe image size is 30×25 mm at 62.5 μm/pixel. (A–C) are linear stretched.

