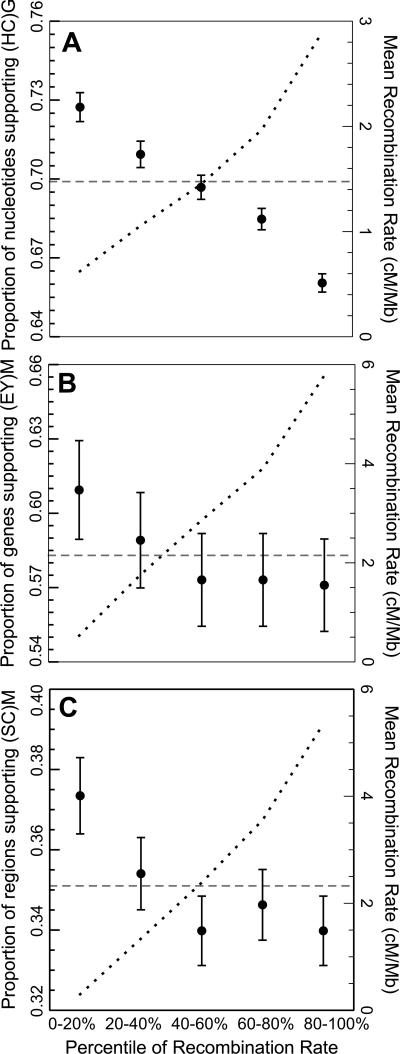
Figure 2.
Regions with low-recombination rates show increased support for the putative species tree in each clade compared to the mean support (dashed line). As the recombination rate increases (dotted line), the support declines and ILS increases. This pattern is consistent in the HCG clade (A), Dmel clade (B), and Dsim clade (C).

