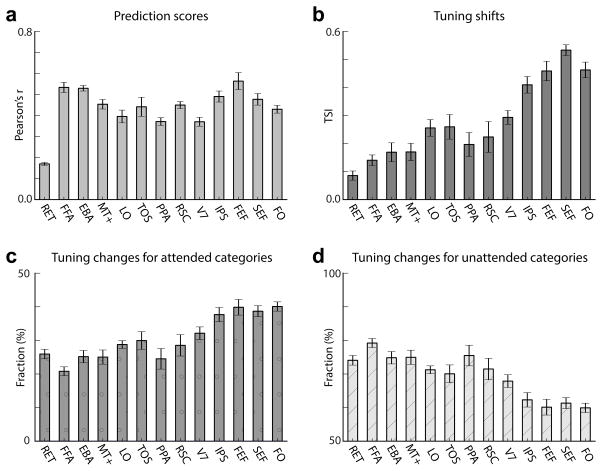
Figure 5. Attention causes different degrees of tuning shifts in functional regions-of-interest.
a, Prediction scores (Pearson’s r; mean±s.e.m. results averaged across all 5 subjects). RET denotes the retinotopically-organized early visual areas V1–V3, and abbreviations for remaining regions-of-interest (ROIs) are listed in Supplementary Table 1. The average prediction score in category-selective areas in occipito-temporal cortex (FFA, EBA, LO, TOS) is 0.48±0.07 (mean±s.d.); and the average prediction score in more anterior brain areas in frontal cortex (FEF, SEF, and FO) is 0.49±0.07 (mean±s.d.). a, Tuning shift indices (TSI; mean±s.e.m.) within functional ROIs. TSI is significantly greater than 0 in all ROIs (Wilcoxon signed-rank test, p<10−6). Furthermore, TSI increases towards relatively later stages of visual processing. c, Fraction of the overall tuning change (mean±s.e.m.) explained by tuning changes for attended categories. d, Fraction of the overall tuning change (mean±s.e.m.) explained by tuning changes for unattended categories (i.e., excluding both ‘humans’ and ‘vehicles’). The degree of tuning shift (i.e., TSI) is positively correlated with the fraction of variance explained by tuning changes for attended categories (r =0.86±0.02, t-test, p<10−6).

