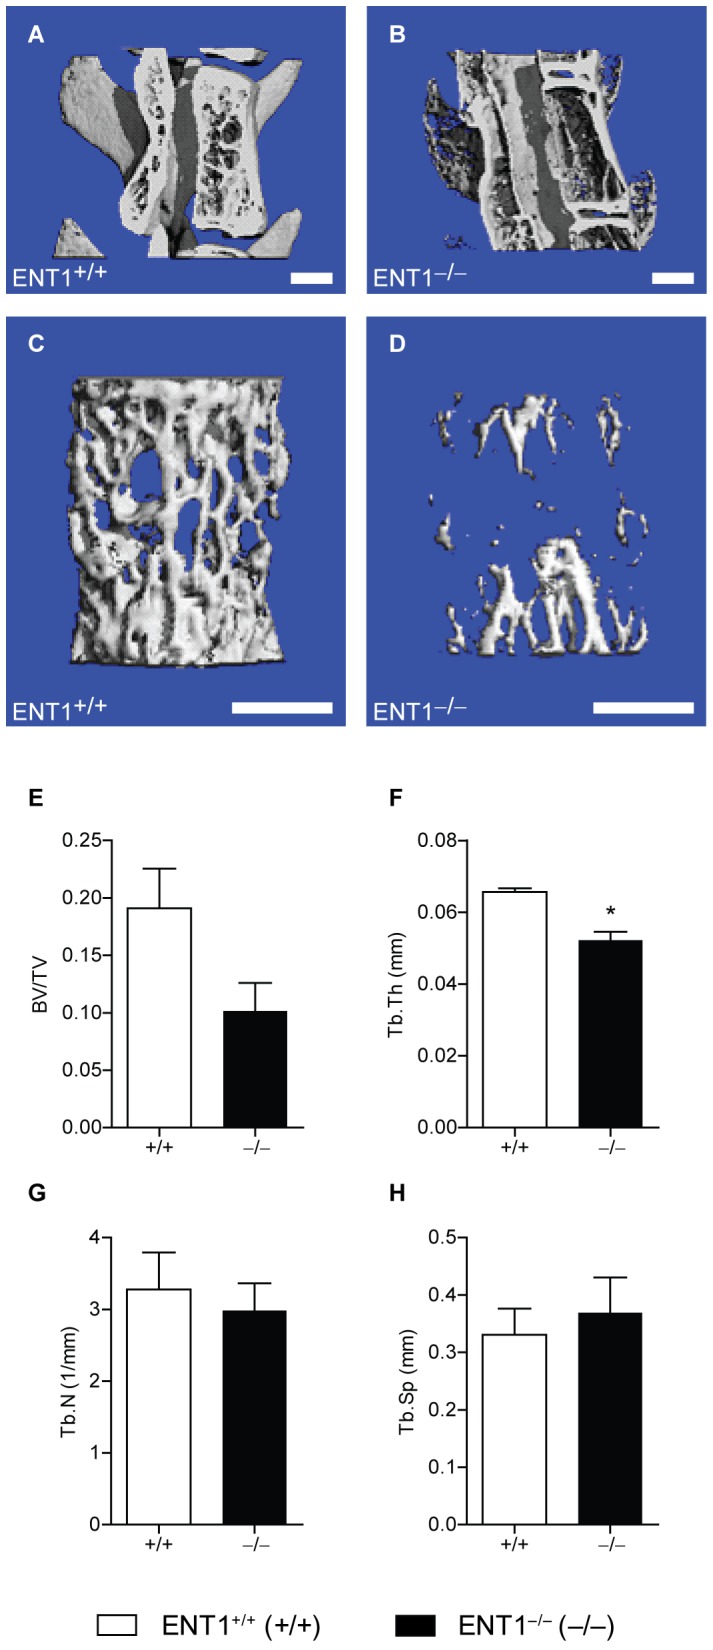
Figure 3. ENT1 null mice present with significantly reduced thickness of trabecular bone within the lumbar vertebral body by micro computerized tomography (microCT).

Representative cross section through the vertebral body of a lumbar spine in (A) wild-type and (B) ENT1 null mice. Scale bar = 1 mm. It was noted that ENT1 null mice have reduced trabecular bone thickness and reduced intervertebral space. Magnified view of the trabecular bone within the lumbar vertebral vertebra of (C) wild-type and (D) ENT1 null mice. Scale bar = 1 mm. E Trend for a reduction in the trabecular bone volume fraction (BV/TV), which is equal to the percentage of the tissue space that is occupied by bone within the lumbar vertebral body, of ENT1 null mice compared to wild-type mice. F Trabecular thickness (Tb.Th) or the average thickness of the trabecular struts was reduced in ENT1 null mice compared to wild-type littermates. G Trabecular number (Tb.N) or a measure of the number of trabeculae within a given space was similar between wild-type and ENT1 null mice. H Trabecular separation (Tb.S) or the average spacing between adjacent trabeculae was similar between ENT1 null and wild-type mice. n = 4–5 per genotype. *P<0.05 by Student’s two-tailed t test. All data are presented as mean ± SEM.
