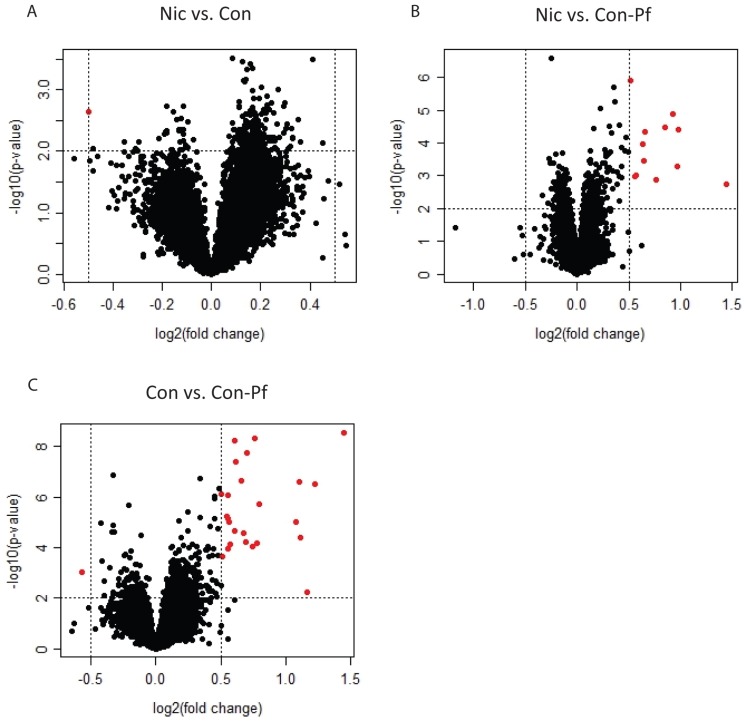
Figure 1. Volcano plots representing group comparisons for all genes included in the analysis.
x-axes represent log2 fold-changes and y-axes represent the –log10(p-values) associated with the t-statistic. Vertical dotted lines are positioned at a log2 fold-change of 0.5 or −0.5 and horizontal dotted lines are positioned at the equivalent of p = 0.01. In red are those genes that are differentially expressed at p<0.01 and log2 fold-change>0.5 or <−0.5. A) Nic vs. Con B) Nic vs. Con-Pf and C) Con vs. Con-Pf.

