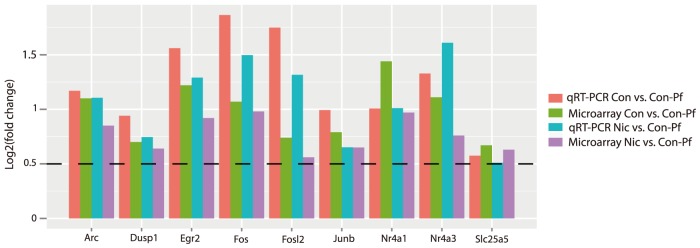
Figure 2. qRT-PCR validation of 9 food-restriction-sensitive genes.

The y-axis represents the log2(fold changes) observed in both comparisons involving the food restricted group. Differences in gene expression using qRT-PCR were consistent with microarray data. The dashed line represents the fold change cut-off (log2(fold change) >0.5) used in the microarray analysis.
