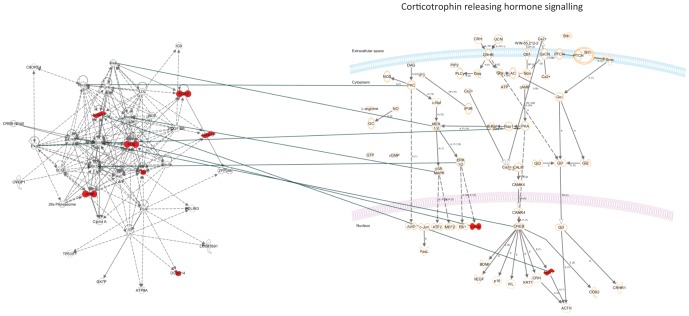
Figure 3. Ingenuity Pathways Analysis of genes identified as differentially expressed in the Nic vs. Con-Pf and the Con vs. Con-Pf comparisons.
On the left is the top network identified consisting of 7/12 genes in our list, and on the right is the top associated canonical pathway. Highlighted red are the genes in our list that were over-expressed due to food-restriction.

