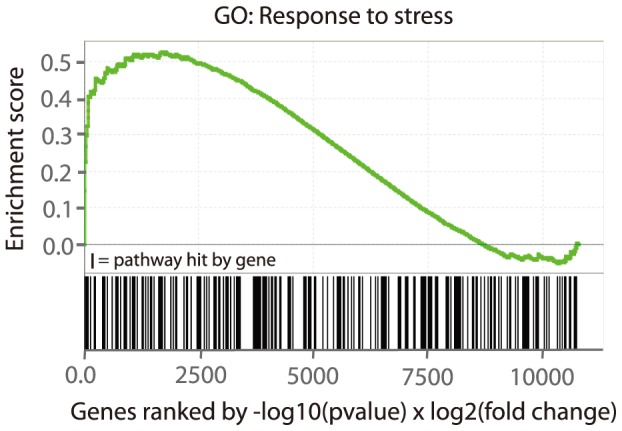
Figure 4. Gene set enrichment analysis (GSEA) of the GO pathway “RESPONSE_TO_STRESS” in the Con vs. Con-Pf comparison.

The input gene list was all genes in the microarray analysis ranked by –log10(p-value)×log2(fold change). The enrichment score profile displays an enrichment of pathway hits at the top of the list, suggesting multiple top-ranked genes involved in the “Response to stress” pathway.
