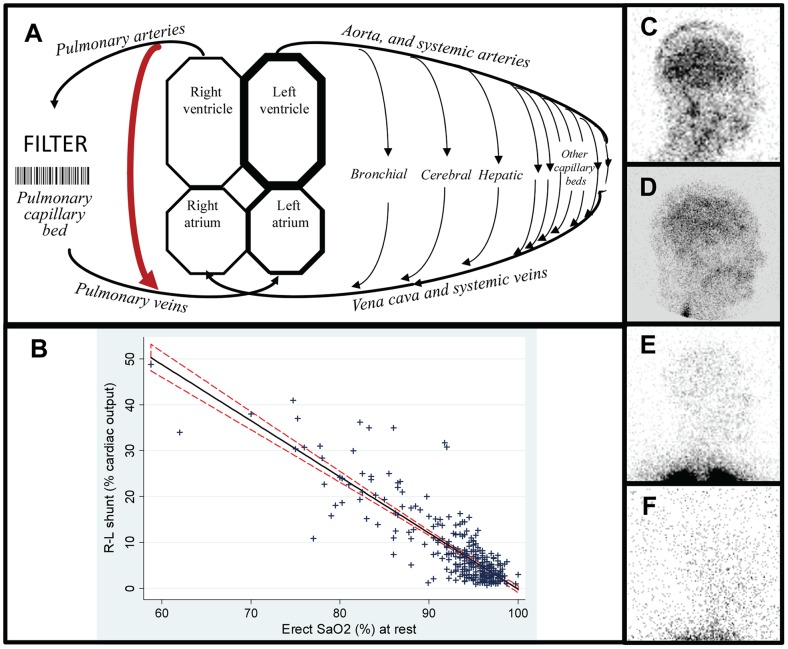
Figure 1. Right-to-left shunt and hypoxaemia evaluations.
A: Cartoon of the circulations indicating site of the pulmonary capillary filter, the dual pulmonary and bronchial/systemic arterial supply to lung tissue, and a pulmonary arteriovenous malformations (PAVM, red arrow). B: Relationship between quantified right-to-left shunt (measured using with 99mTc-labelled albumin macroaggregates (10–80 µm) or microspheres (7–25 µm)), with same-day oxygen saturation (SaO2), representing 309 paired values in 198 individuals since 1999. The linear regression coefficient of −1.22 (95% CI −1.31, −1.14; p<0.0001) indicates a strong relationship that explains 73% of the total variance in erect SaO2 (adjusted r2 0.73). The shunt explained a smaller proportion of the total variance in supine SaO2 (adjusted r2 0.54, data not shown). C–F: Representative right lateral brain images following injection of 99mTc-labelled albumin macroaggregates for shunt diagnosis and quantification: C) R-L shunt 48.8% of the cardiac output, associated with a resting SaO2 of 59%. D) R-L shunt 25%; SaO2 83%. E) R-L shunt 7.7%; SaO2 93.7%. Note the intense activity in the lung apices as expected. F) R-L shunt 3.3%; SaO2 96%. Note that the gain has been turned up but no cerebral activity is visible. This is the same individual as in D), with the images taken 6 months before (D) and 3 months after (F) embolisation which obliterated the causative PAVMs.

