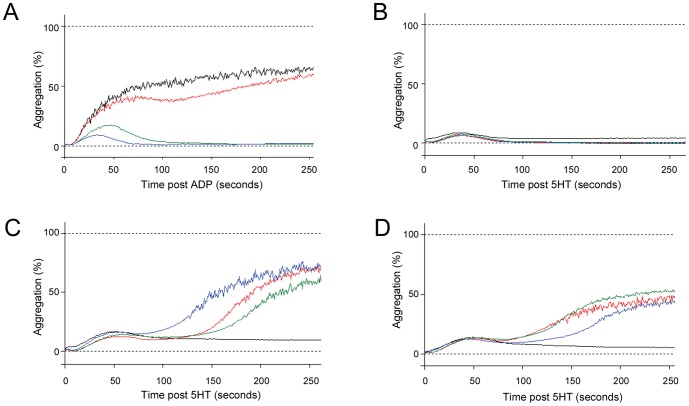
Figure 3. Representative platelet dose response curves.
A) Typical control and iron deficient responses to ADP at 5 (blue), 10 (green), 20 (red) and 50 (black)µM. B) Typical control dose response curves to 5HT at 20 (blue), 200 (green), 2,000 (red) and 20,000 (black) µM–note the absence of the secondary wave of aggregation. C) Representative 5HT dose response curves displaying delayed secondary wave of aggregation observed in all severely iron deficient patients (hemoglobins 5.0–7.5 g/dl). The traces illustrated (5HT at 20 (blue), 200 (green), 2,000 (red) and 20,000 (black)) µM were from an individual with ferritin 4 µg/L, iron 3 µmol/l, hemoglobin 7.5 g/dl. D) Traces from the same individual as in (C), following a 6 month course of iron that resulted in improved iron indices (ferritin 31 µg/L, iron 7 µmol/l, hemoglobin 10.5 g/dl). Note that despite further treatments, iron deficiency persisted due to ongoing hemorrhagic losses. Aggregation curves are displayed for 5HT at 20 (black), 200 (green), 2,000 (red) and 20,000 (blue)µM.

