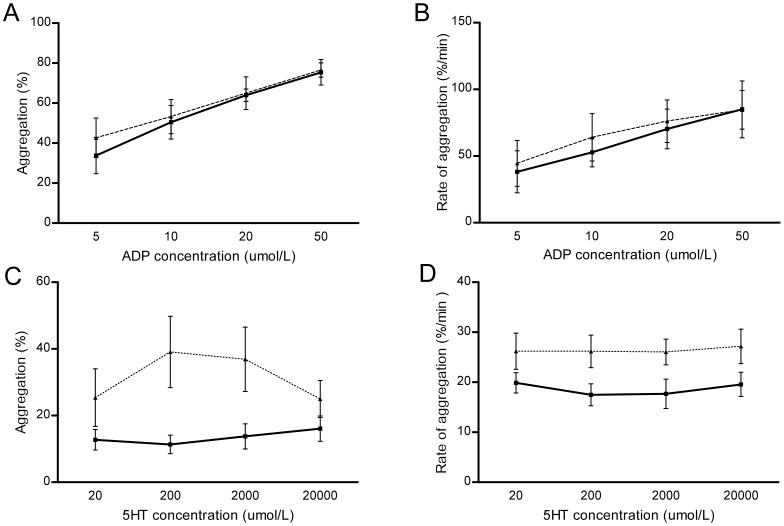
Figure 4. Comparison of platelet dose response curves in response to agonists in iron deficient patients and controls.
Solid lines indicate controls; dotted lines represent the iron deficient group. Error bars represent standard error of the mean. A) Total aggregation in response to ADP at 5–50 µmol/L. B) Rate of aggregation in response to ADP. Since circulating blood should spend less than two seconds between pulmonary transits, the rate of aggregation may be particularly relevant. C) Total aggregation in response to 5HT. D) Rate of aggregation in response to 5HT.

