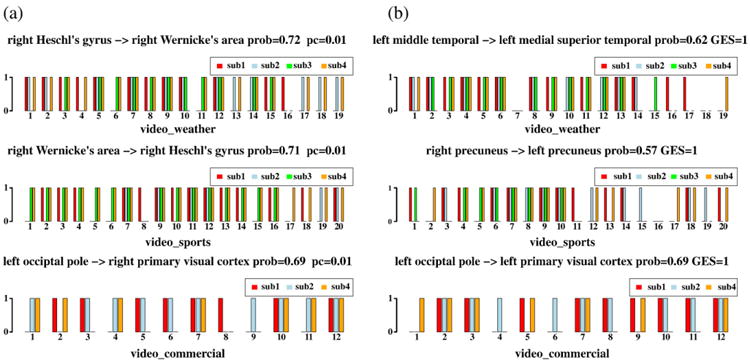
Fig. 10.

The distributions of the most consistent interaction connections in each video category from the results of both PC (a) and GES (b) algorithms. For each subplot, the horizontal axis represents the index of video shots for each semantic category. The name of video category is at the bottom of each subplot, The ROIs' names for the interaction pair, probability of the occurrence of the interaction patter, and threshold used are at the top of the subplot. The black arrows represent the interaction directionality. Four subjects are represented by the colors of red, blue, green and orange, respectively. The horizontal axis stands for binary decision of existence (1) or non-existence (0). It is noted that for the video category of commercial advertisement, we only have datasets from three subjects. The label pc=0.01 means that the PC algorithm is run under the type one error 0.01 and the label GES=1 means that we used the penalty parameter c=1.
