
Fig. 5.
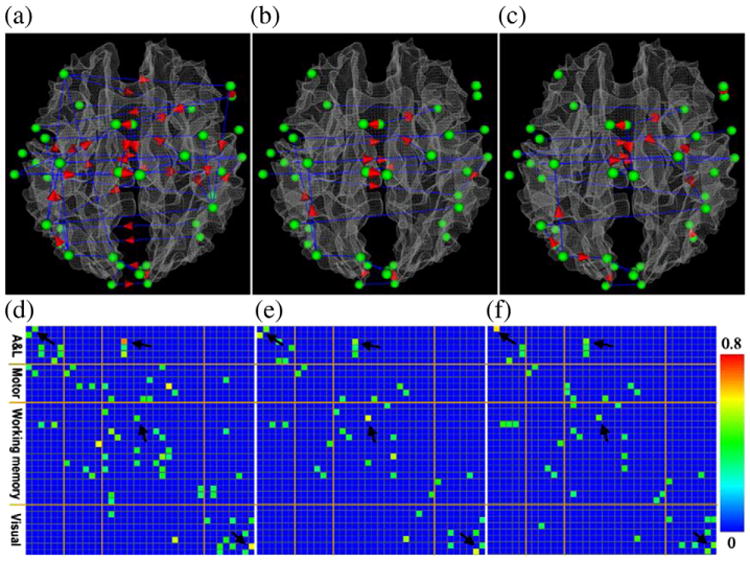
Visualization of the consistent connectivity patterns inferred via PC algorithm (pc=0.01) in the functional brain regions include auditory and language, motor, working memory and visual systems when subjects watched video clips. Panels (a), (b) and (c) show the consistent functional interaction patterns for video categories of advertisement, sports and weather reports, respectively. The nodes of the functional networks are represented as green spheres. The blue lines without arrows and with red arrows represent non-directional and directional interaction connections, respectively. Panels (d), (e) and (f) show the significance of consistency of the interaction connections demonstrated in panels (a), (b) and (c), respectively. The color bar is on the right side.